Fieldnotes / The visual compendium
The systems between us.
30 visual ideas, one connected question: how do we build intelligent systems that remain accountable to the people they affect?
An editorial arrangement of infographic images from Professor Amandeep Sidhu’s research collection. The connecting narrative and short captions are interpretations, not reported findings; diagrams that discuss policy or regulation should not be taken as official guidance. Original Drive files remain private.
First, build the ground.
AI does not arrive as a weightless abstraction. It arrives through power, water, compute, institutions and the people who set their limits. The journey starts with the systems beneath the system.
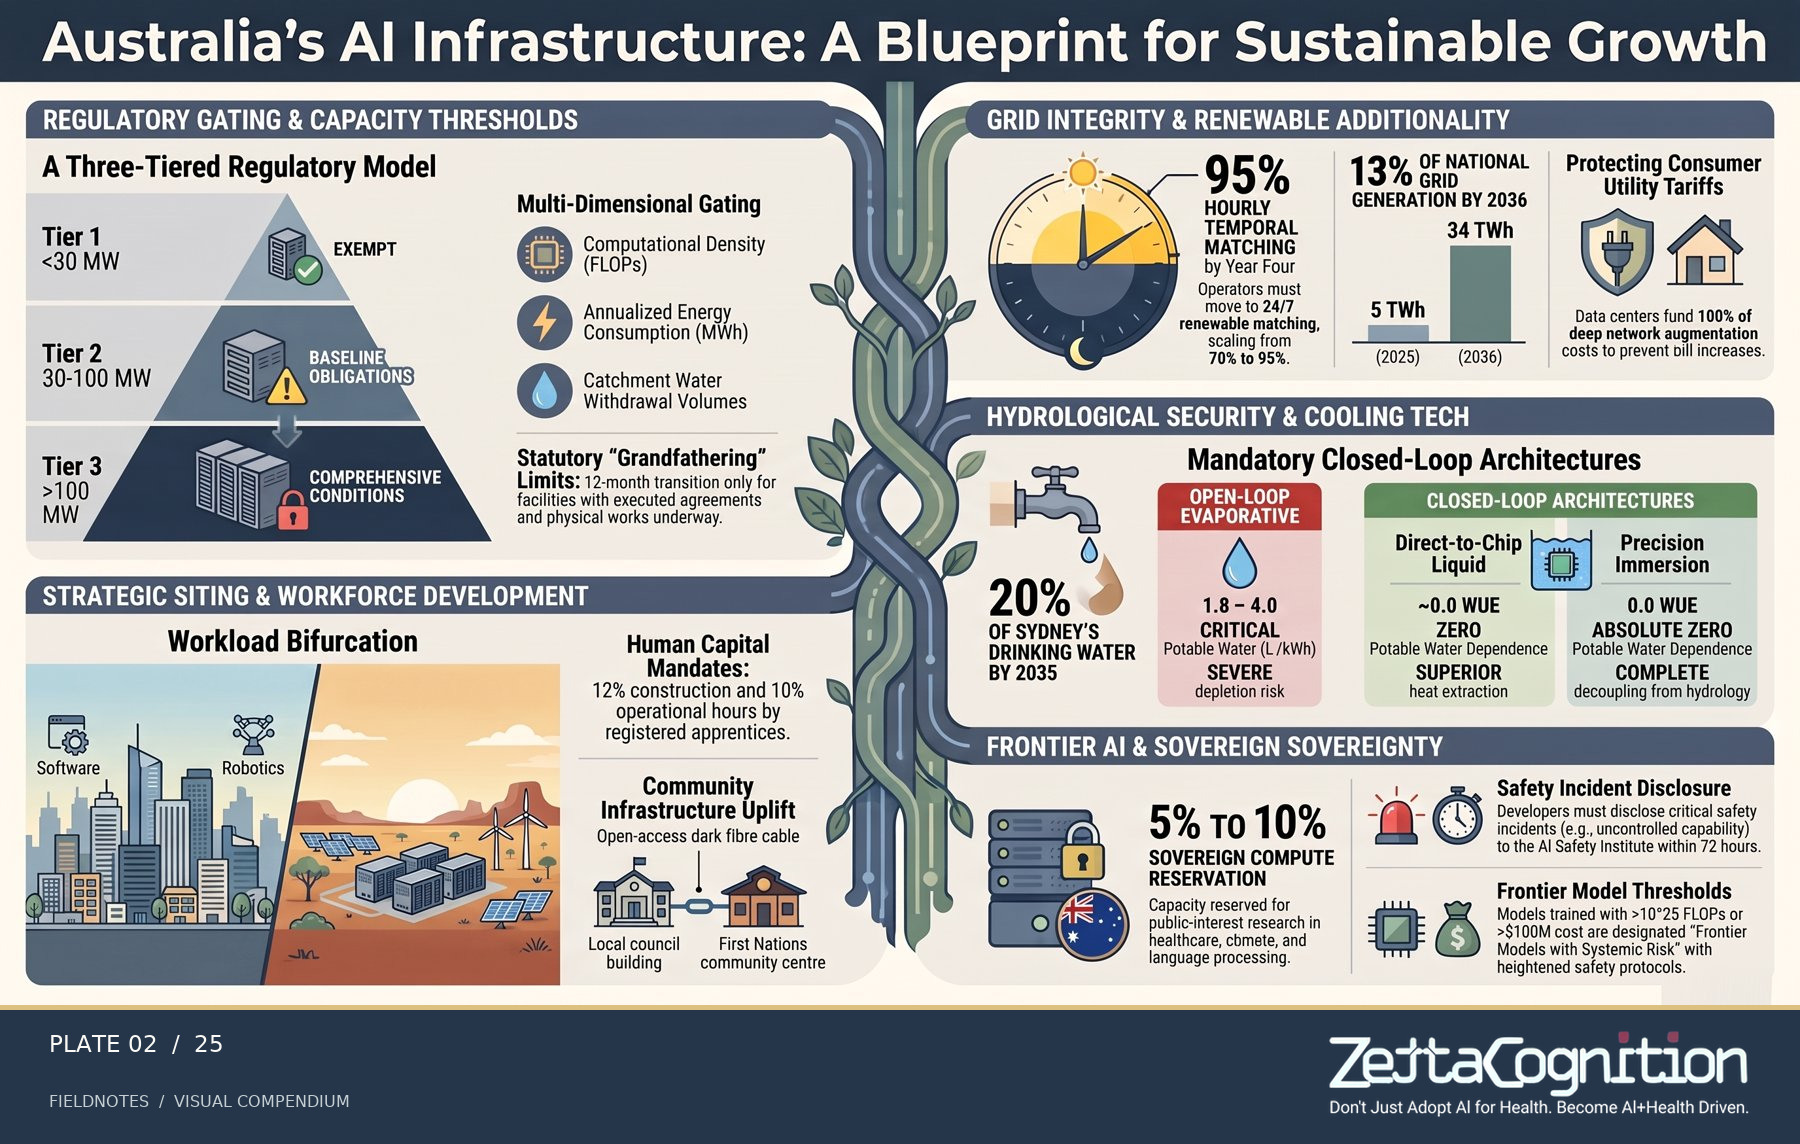
A sustainable AI infrastructure
A blueprint for considering energy, water, compute and public benefit together.
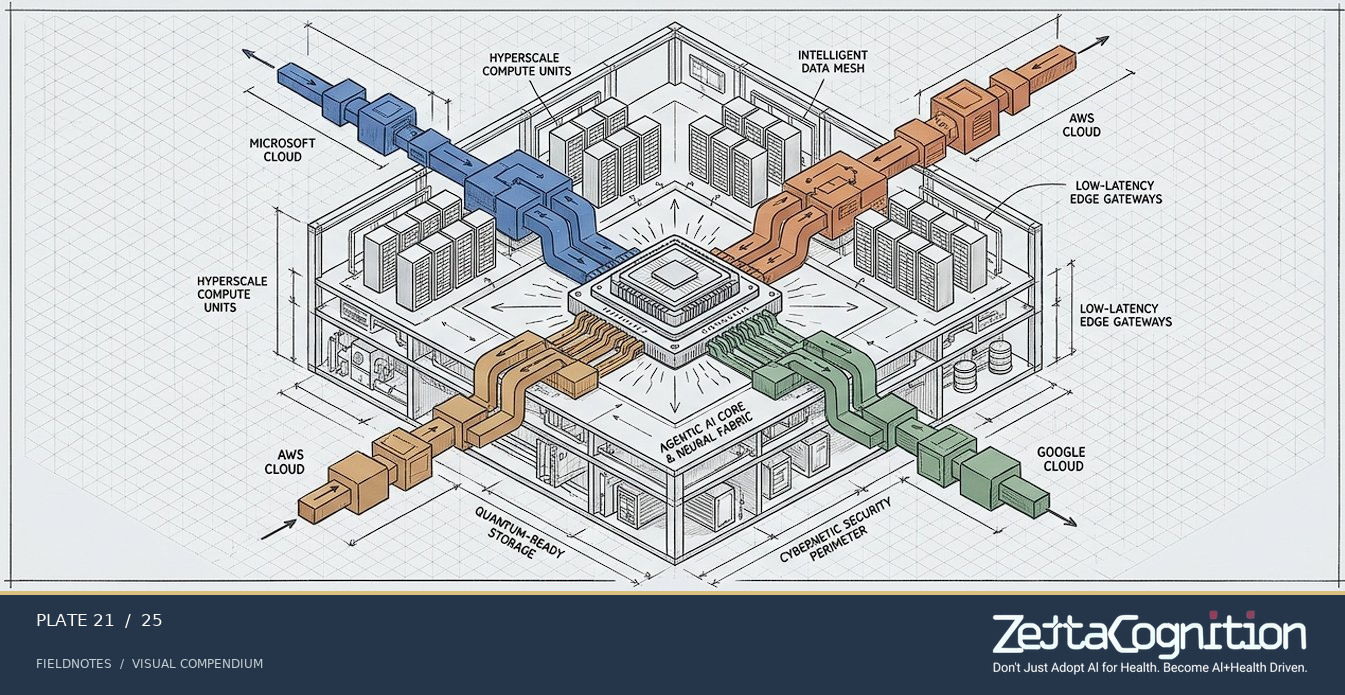
The architecture underneath
A systems drawing that makes the many layers behind a digital service visible.
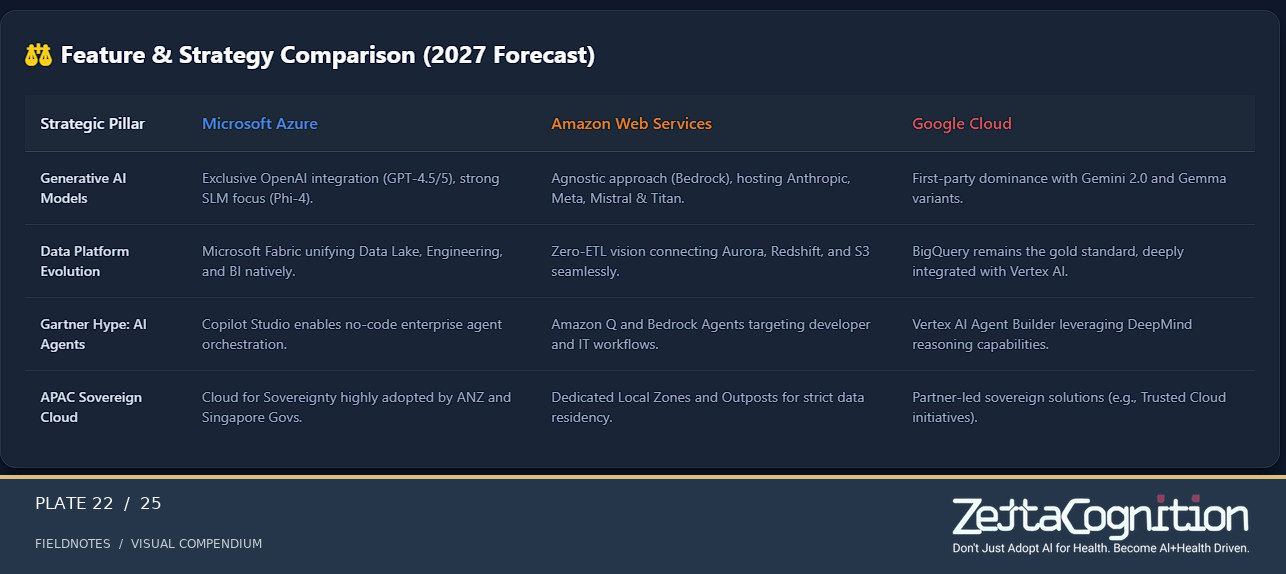
A forward-looking strategy
A planning frame for the next wave of AI infrastructure choices.
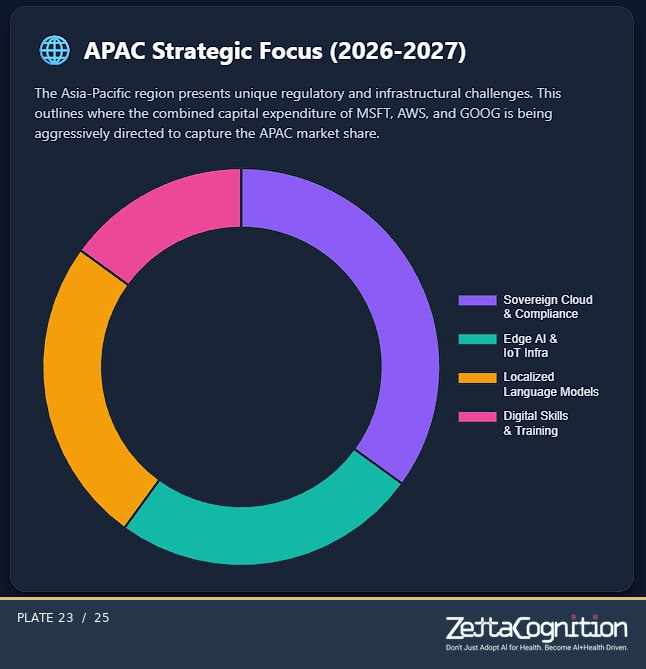
APAC cloud-provider strategy
A proposed allocation of APAC cloud opportunities across provider categories; a strategic illustration, not a student-access measure or forecast.
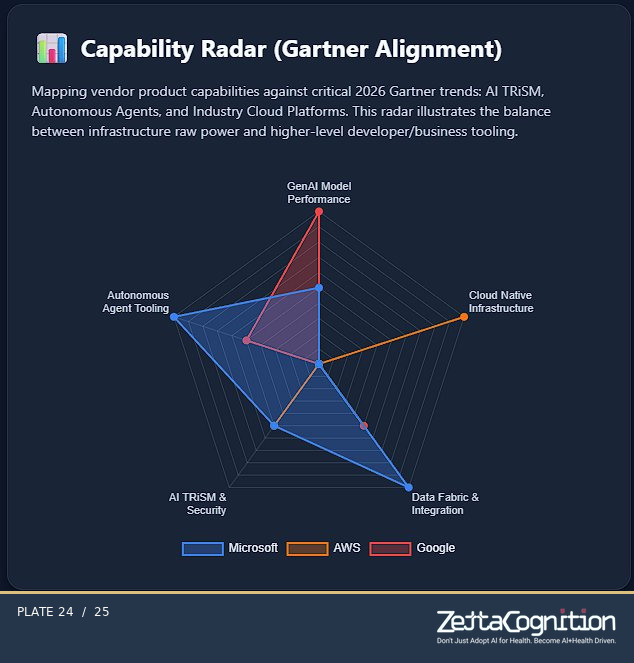
The APAC strategic space
A regional strategy snapshot; a lens on priorities, not a forecast of outcomes.
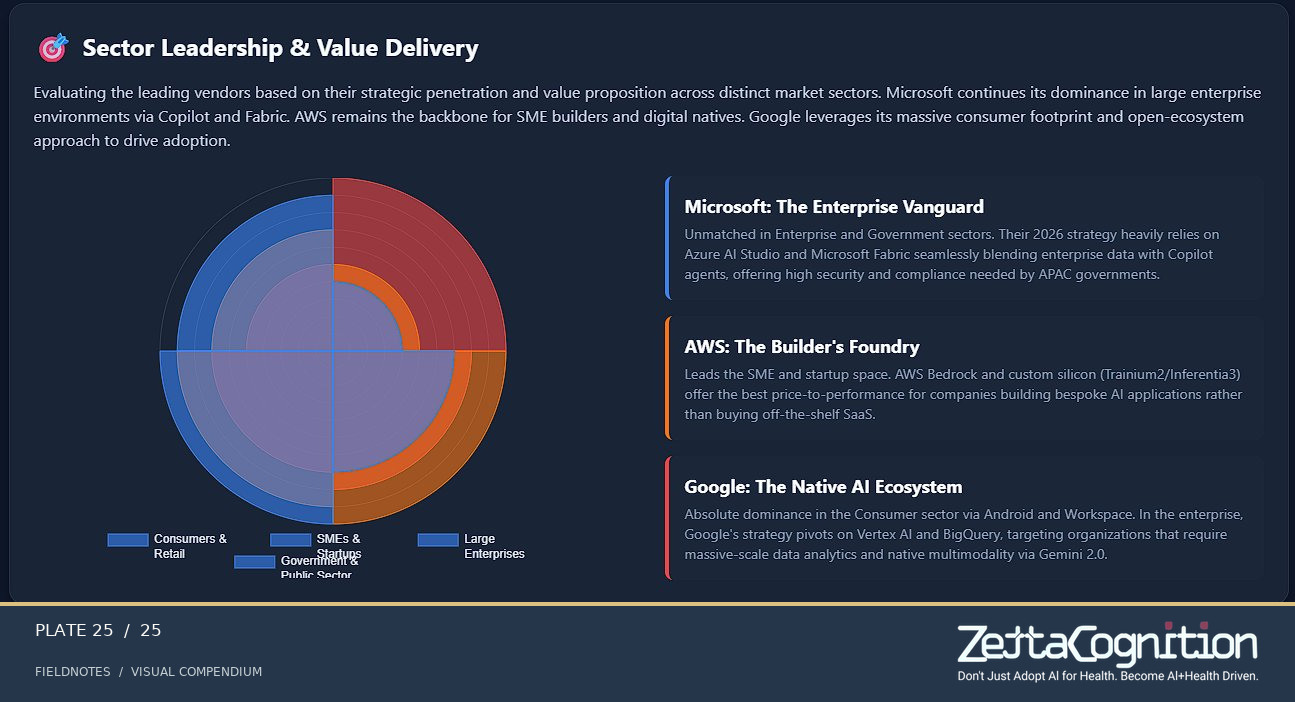
Capabilities in tension
A radar view of trade-offs in strategy, skills and readiness.
Infrastructure becomes consequential when its decisions move faster than human review. That takes us from what we build to how we govern it.
Then, make power accountable.
A capable system is not necessarily a trustworthy one. These diagrams move from automated trading to institutional AI: who sets a boundary, who sees a warning, and who can intervene?
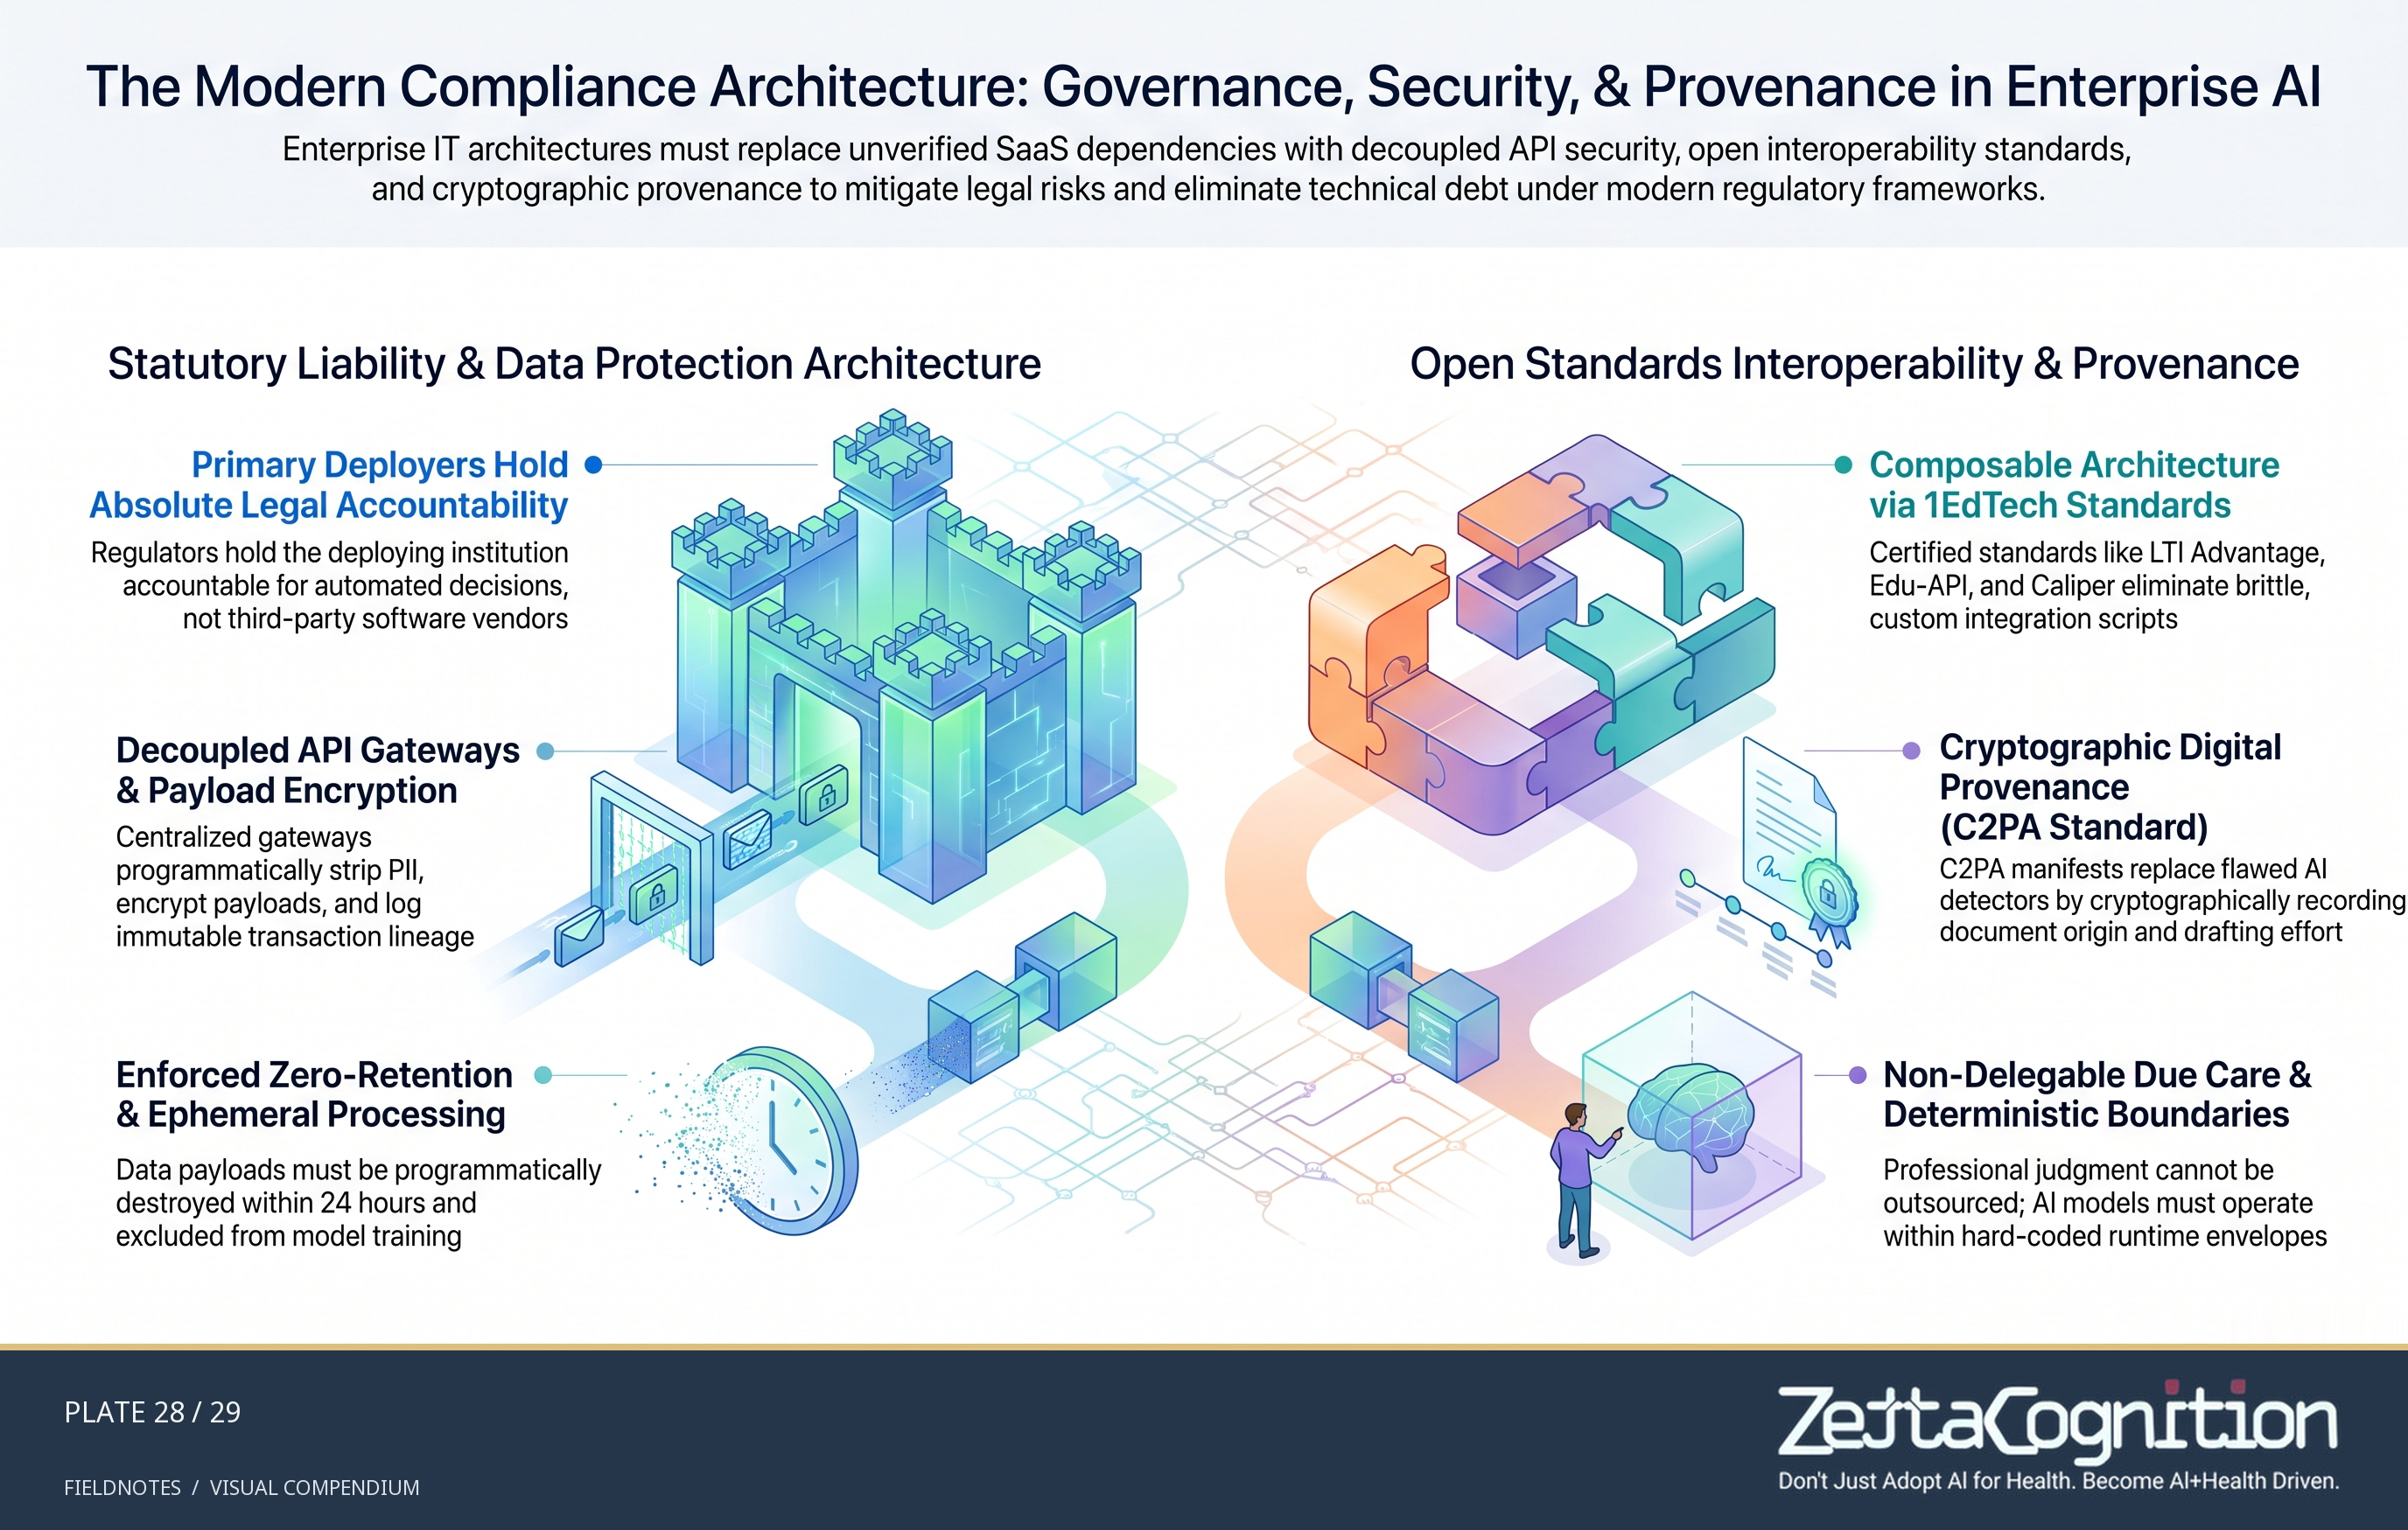
Modern compliance architecture
A proposed EdTech and enterprise AI architecture connecting institutional gateways, open standards, oversight and provenance. Legal labels, zero-retention wording and thresholds in the original research artwork are not compliance findings; see the linked story for verified dates and qualifications.
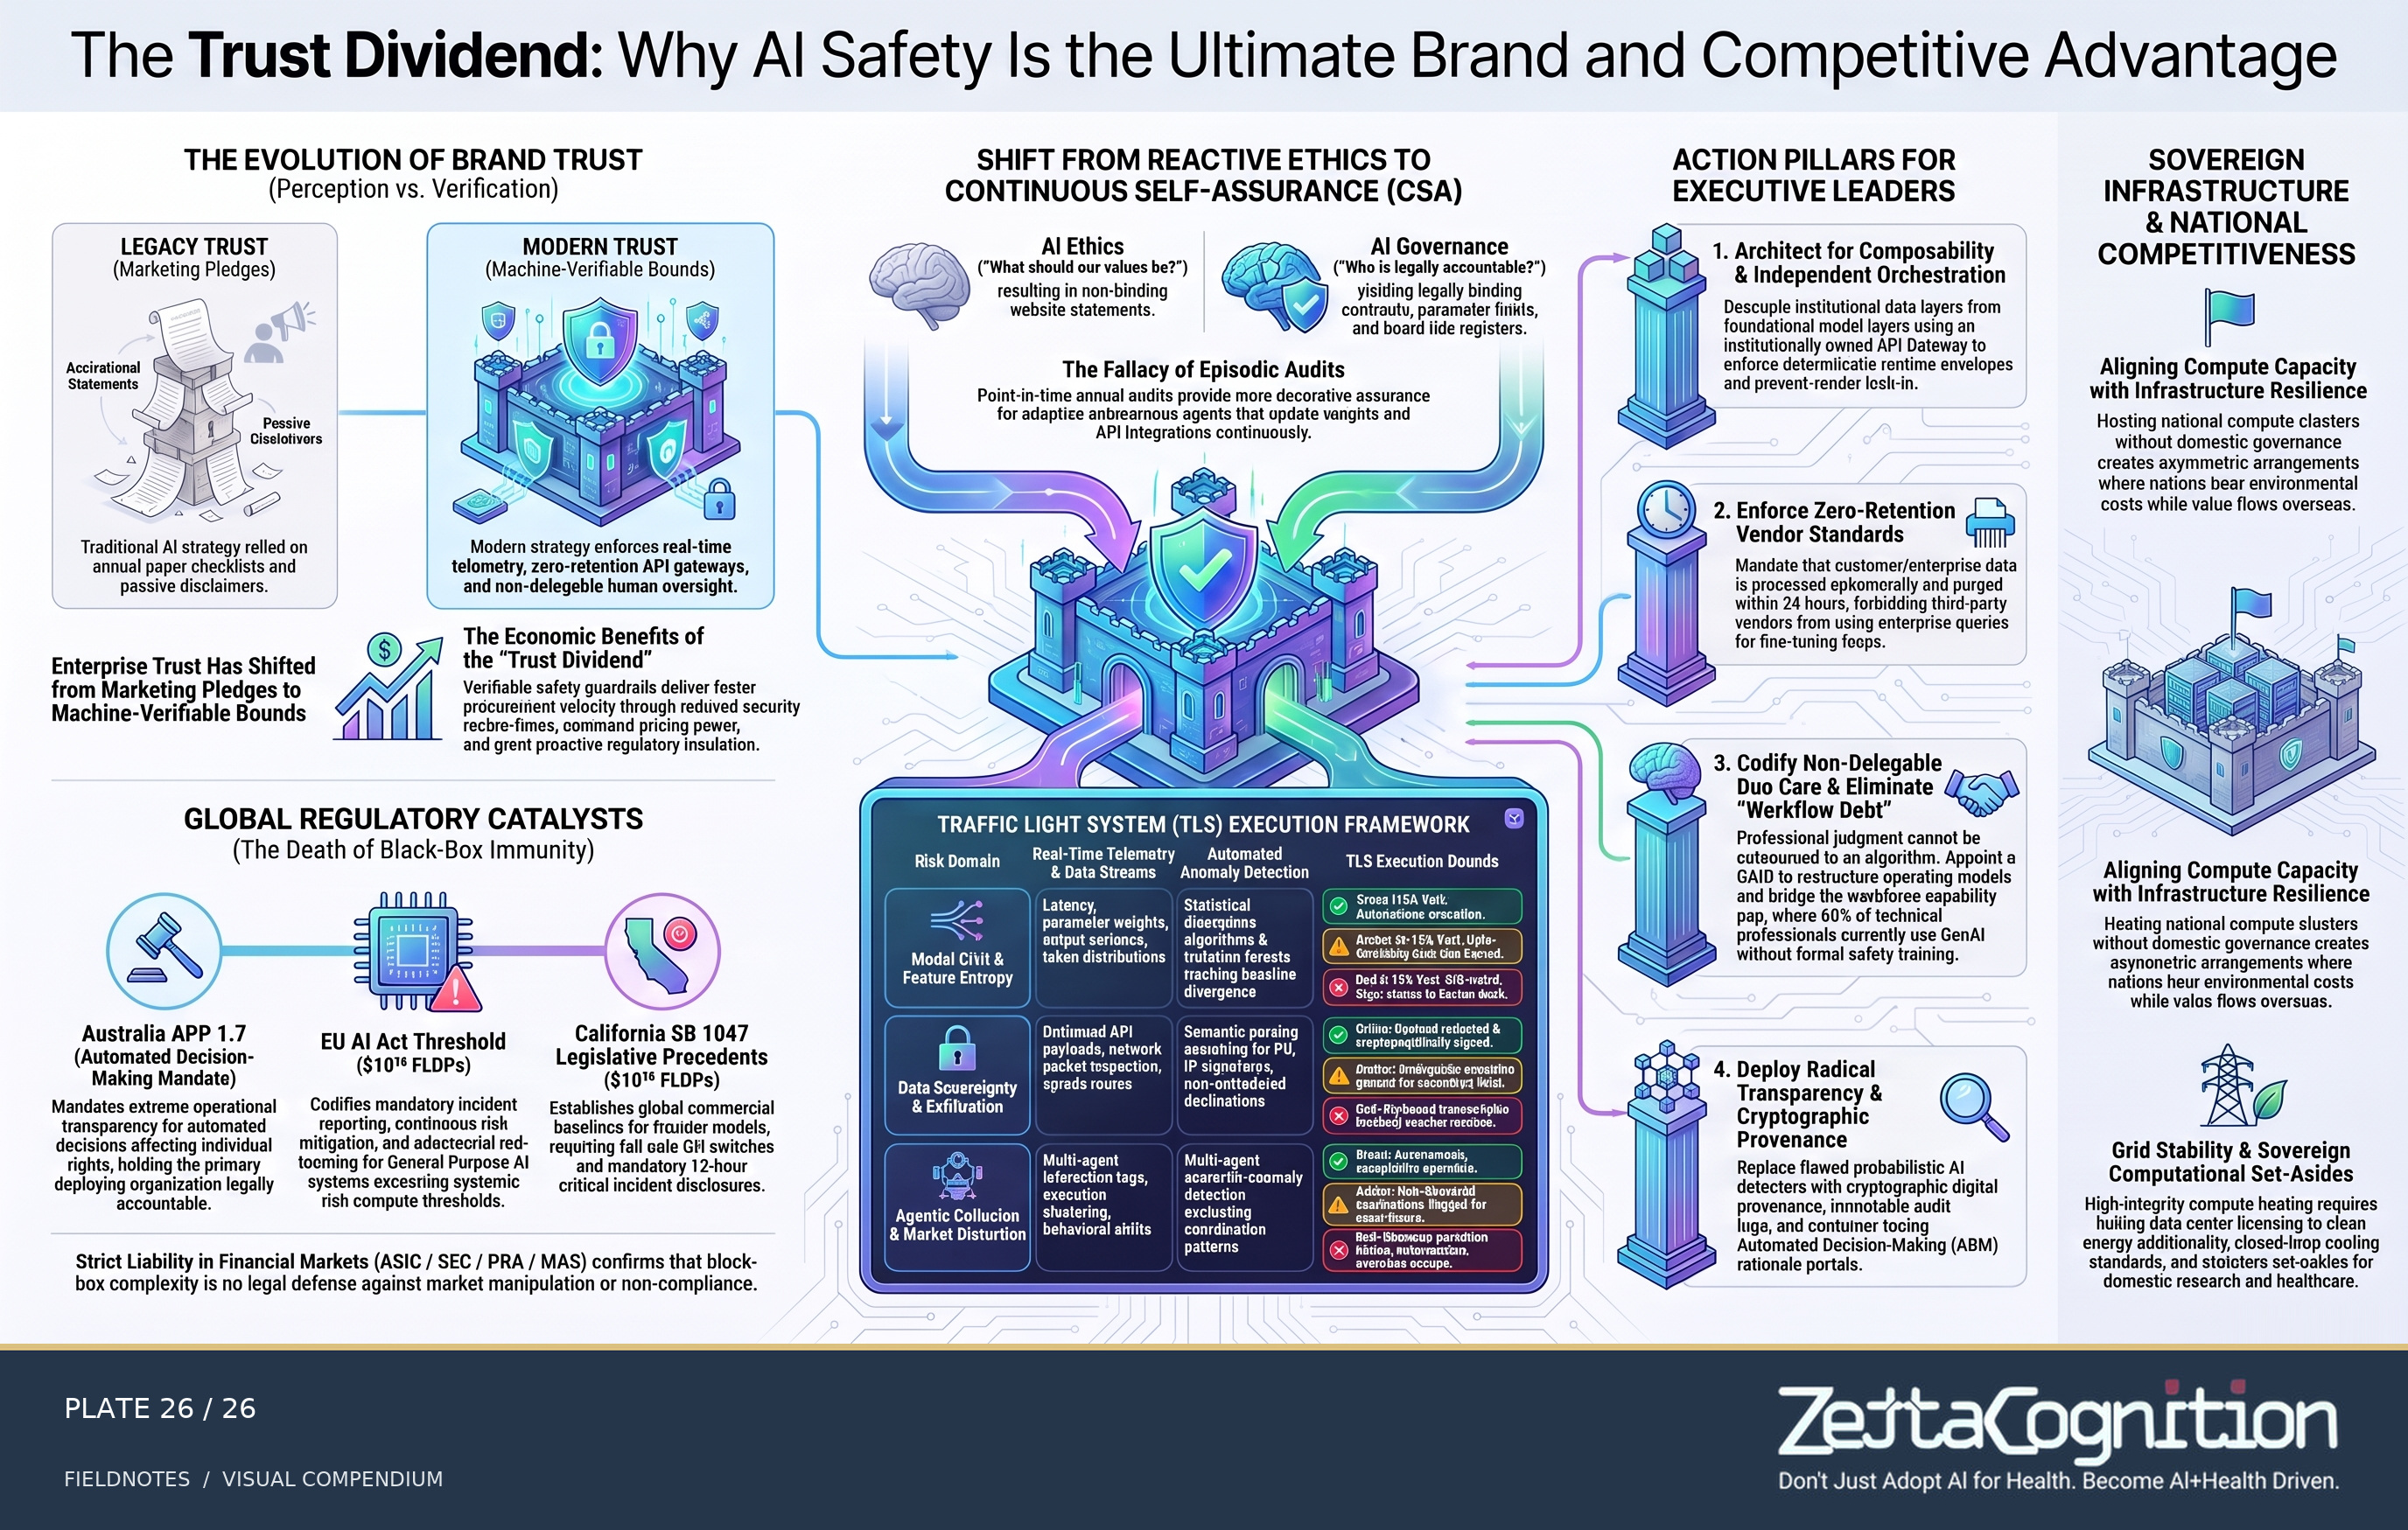
The trust dividend of AI safety
A research proposal for making safety verifiable through continuous assurance, accountable oversight and infrastructure choices; legal references and thresholds are illustrative, not compliance guidance.
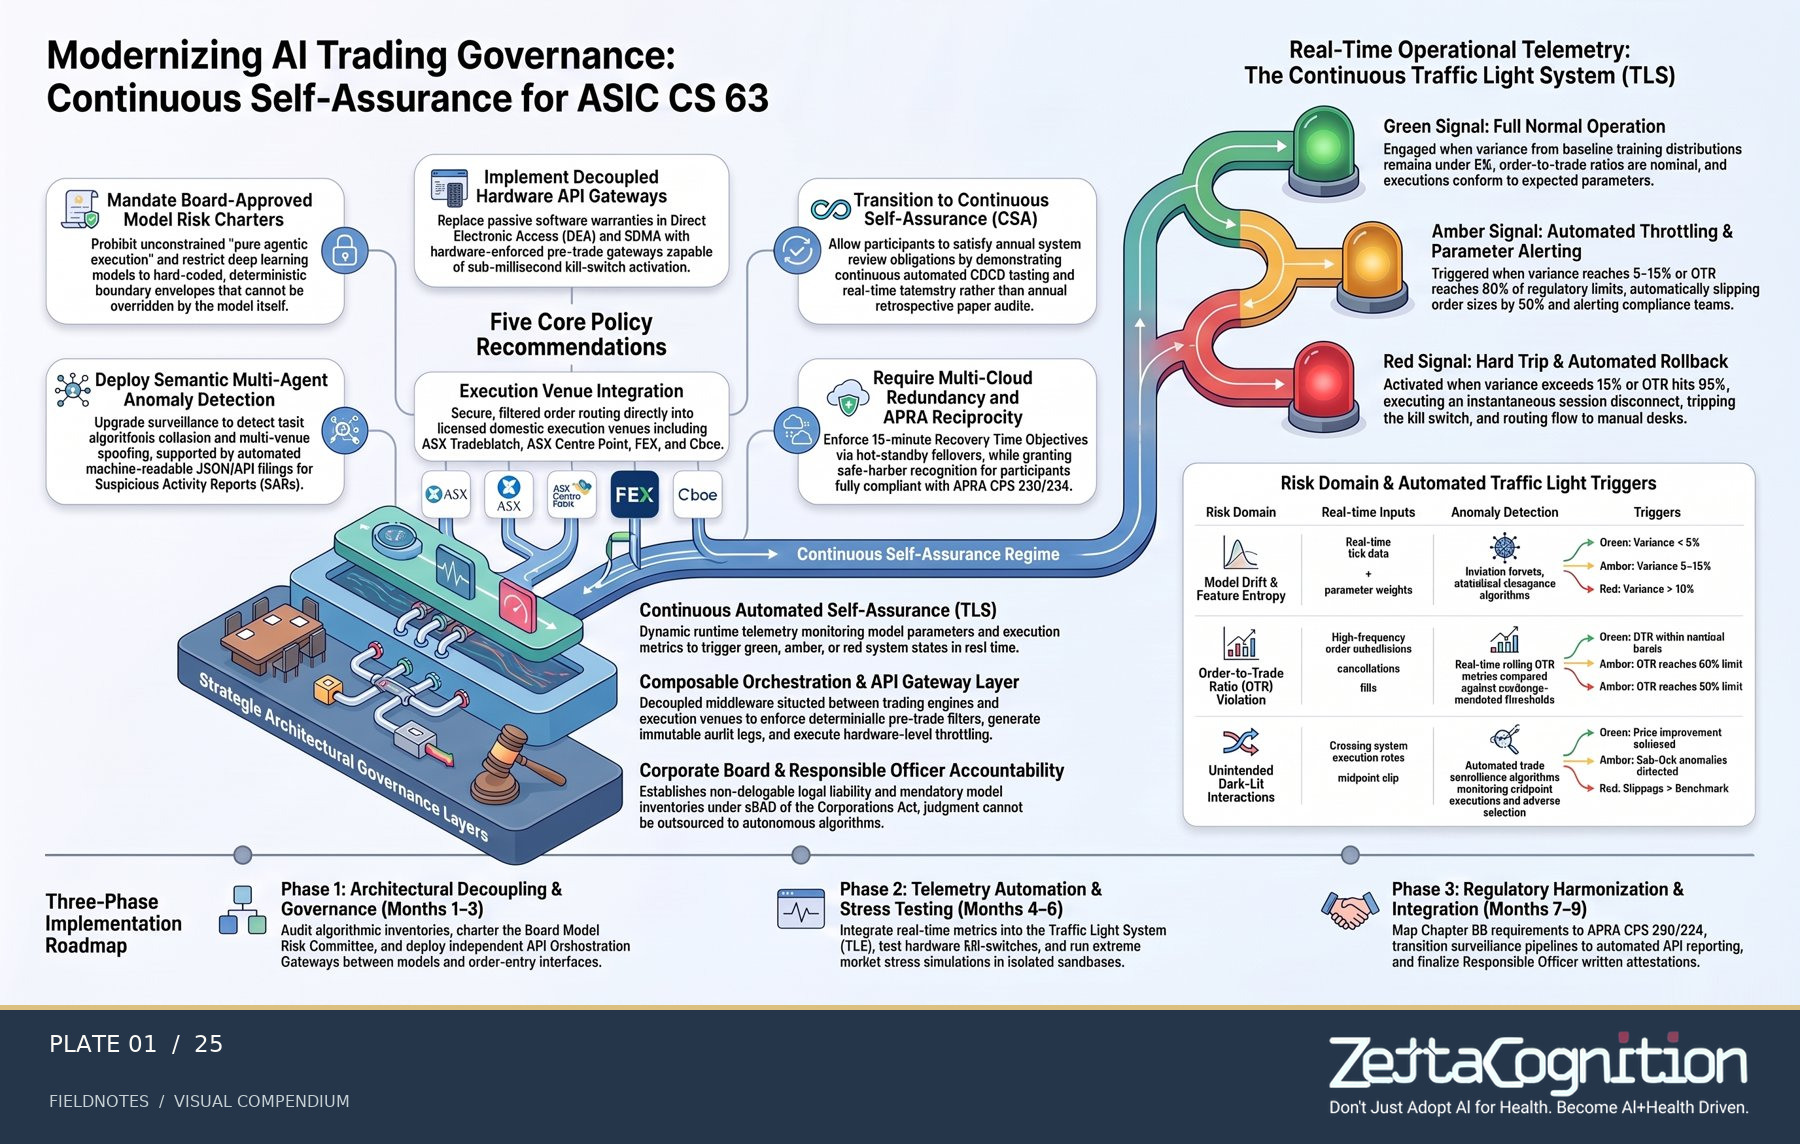
Governance at machine speed
A proposed control loop for AI-assisted trading: limits, escalation and human authority.
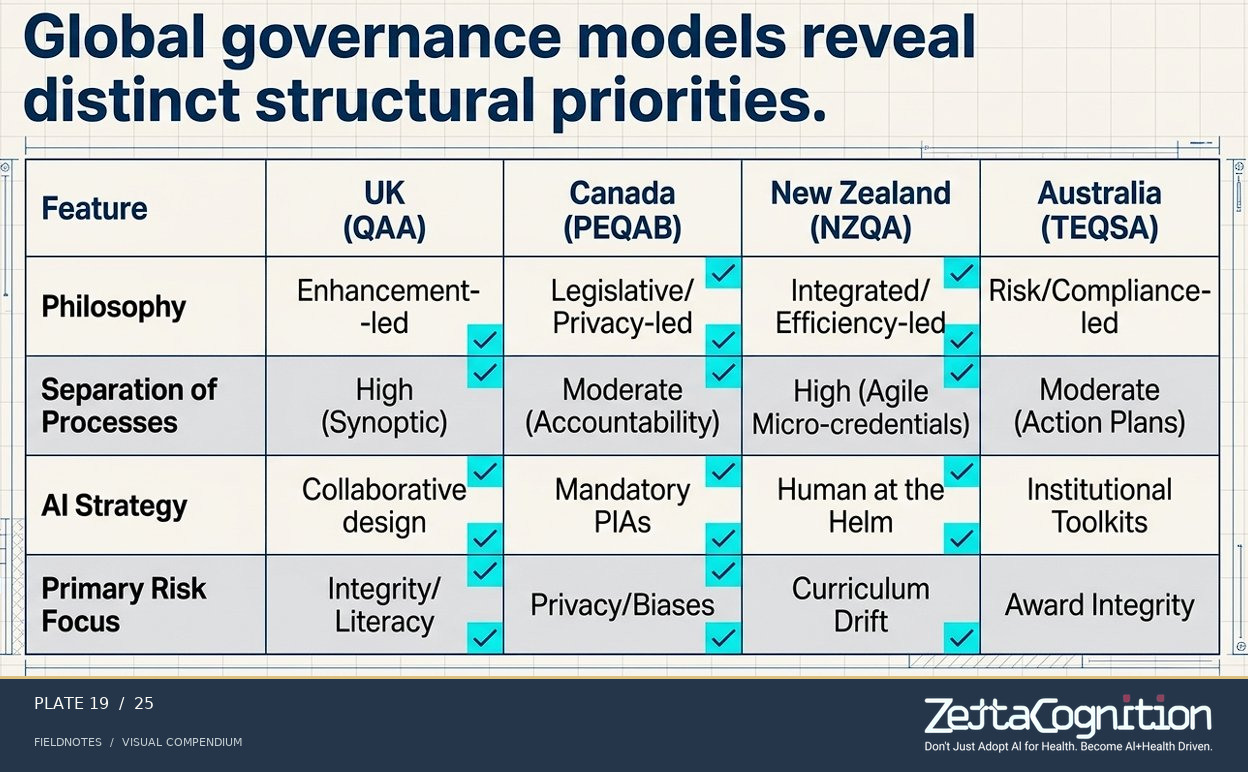
Governance models compared
An illustrative comparison of approaches across jurisdictions; not a legal compliance guide.
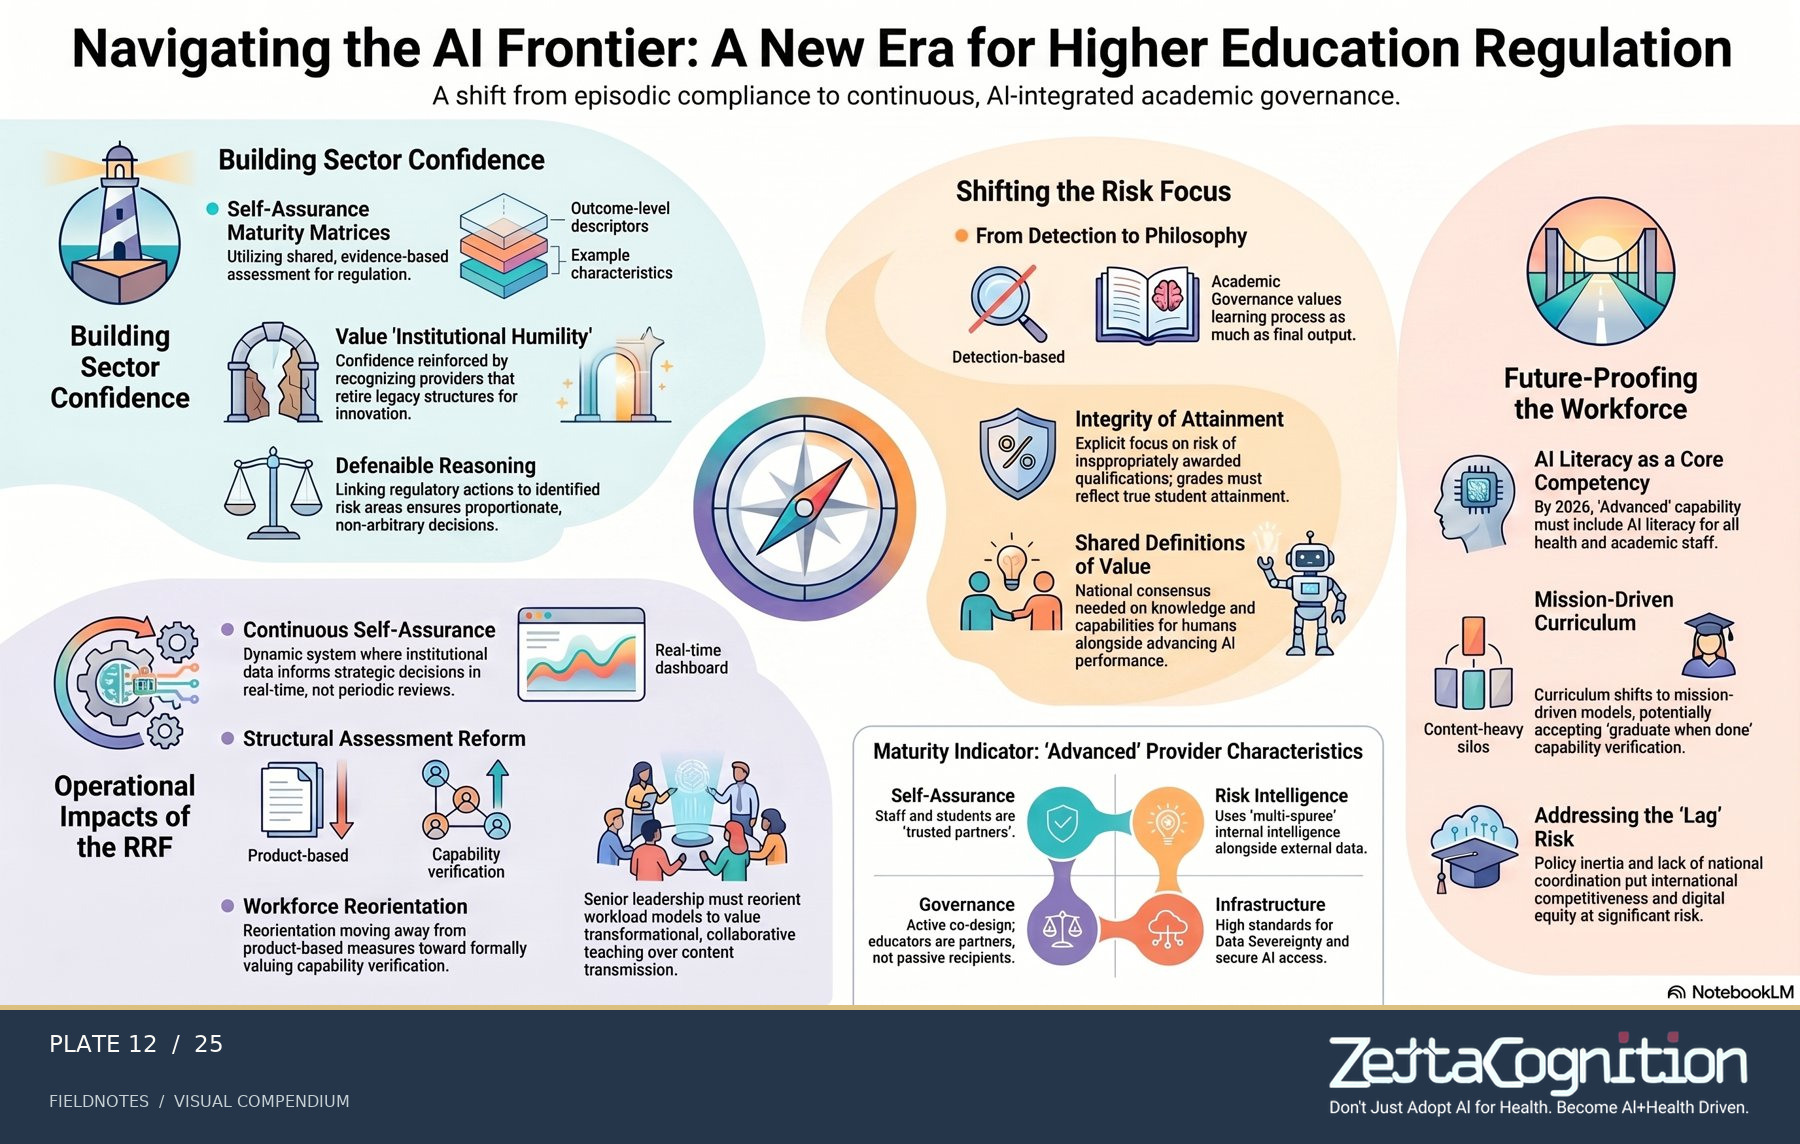
The regulatory question
How institutional responsibilities could be translated into practical oversight.
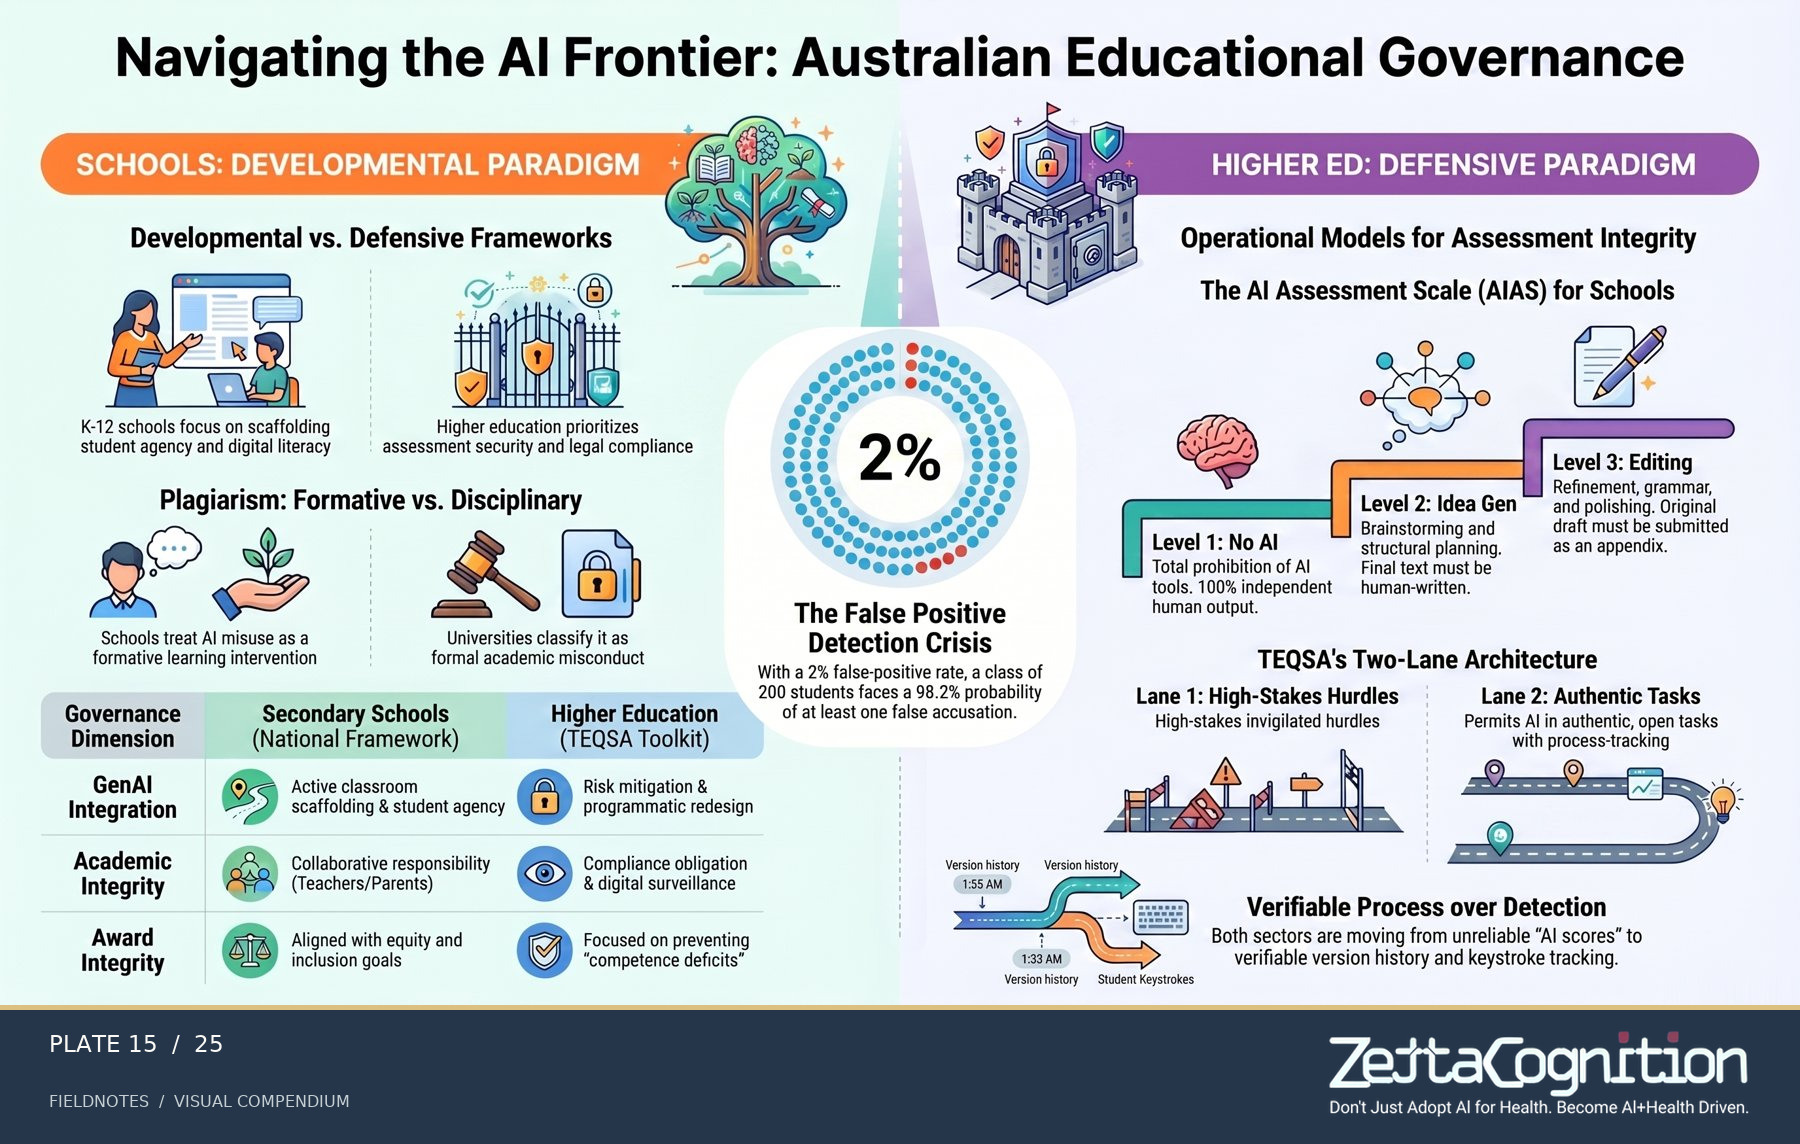
An education governance map
A view of the actors, principles and decision points involved in education AI.
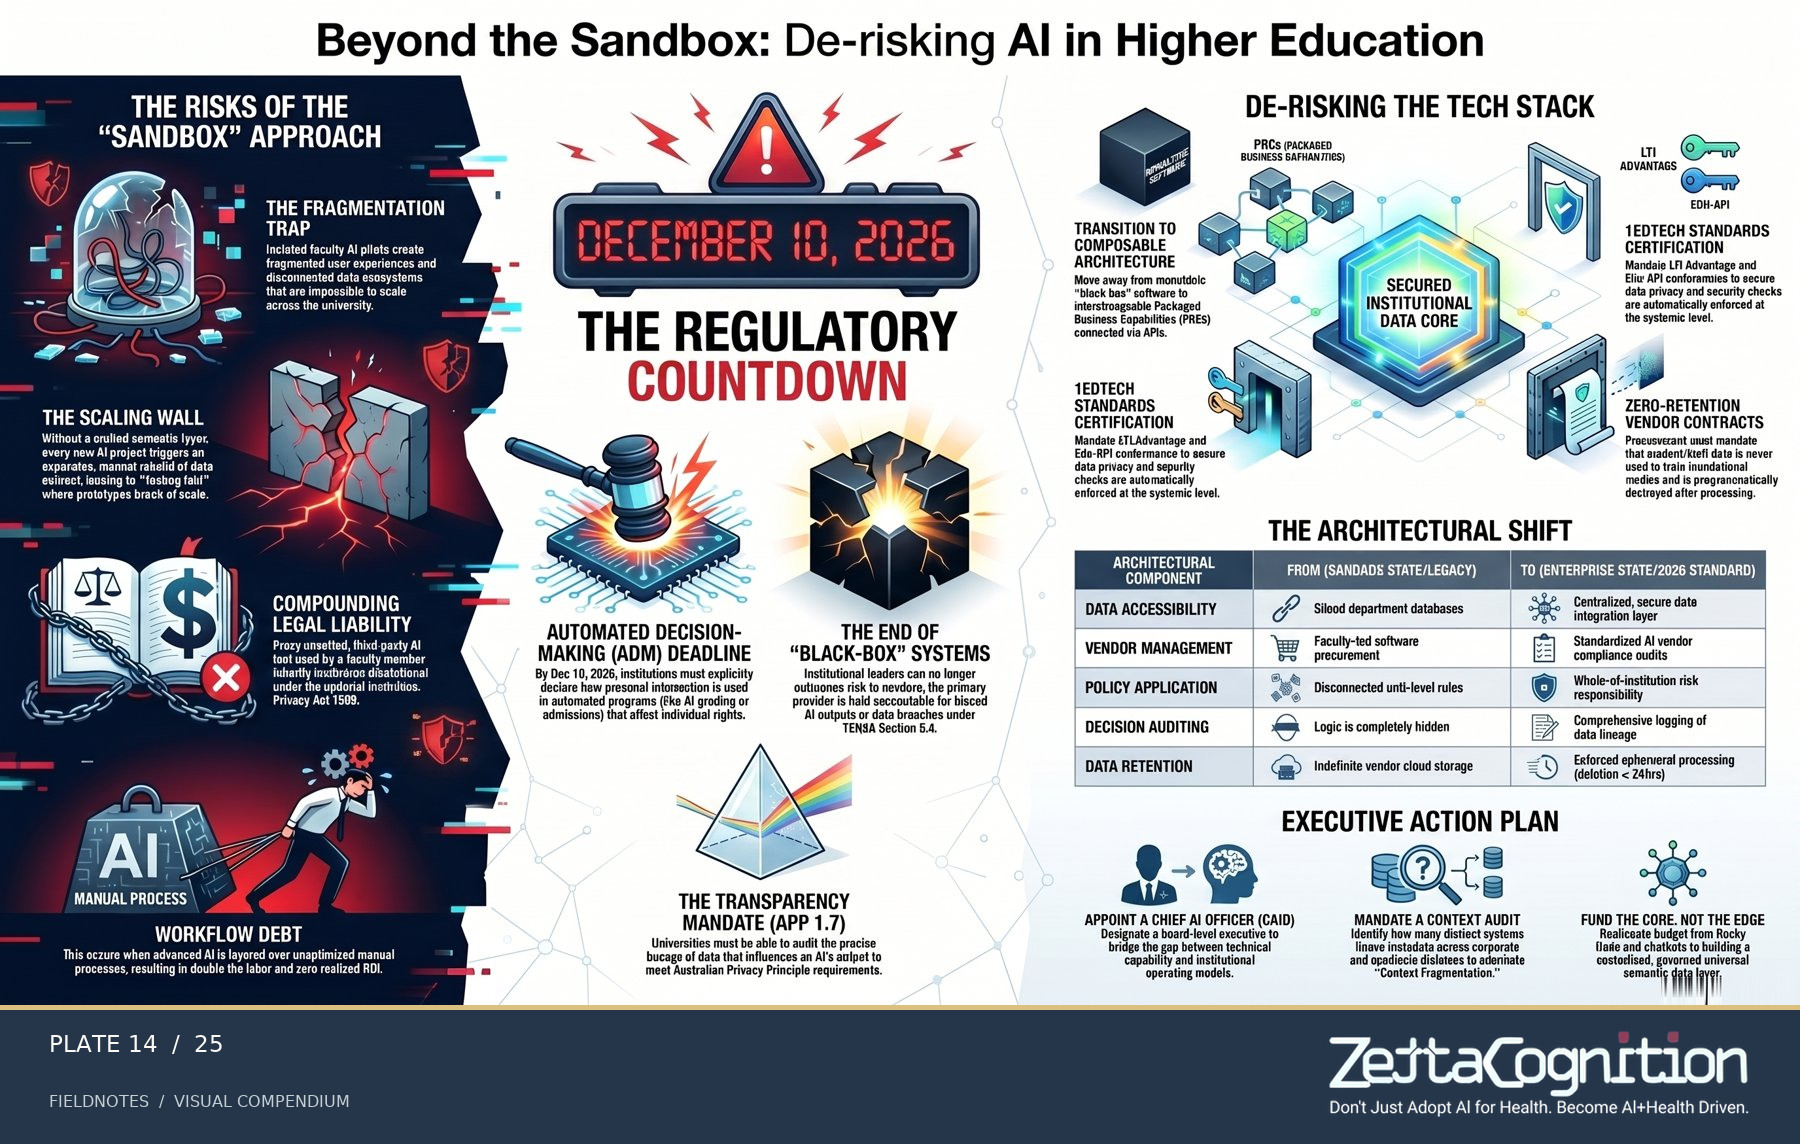
De-risking the institution
Bringing use cases, safeguards and ownership into the same frame.
In universities, accountability must become more than an AI policy. It has to reach the daily work of teaching and assessing.
Redesign how we learn.
When generative tools can produce an answer, the important question shifts: what can a learner actually reason through, demonstrate and carry into practice? The diagrams move from changing curricula to credible evidence of learning.
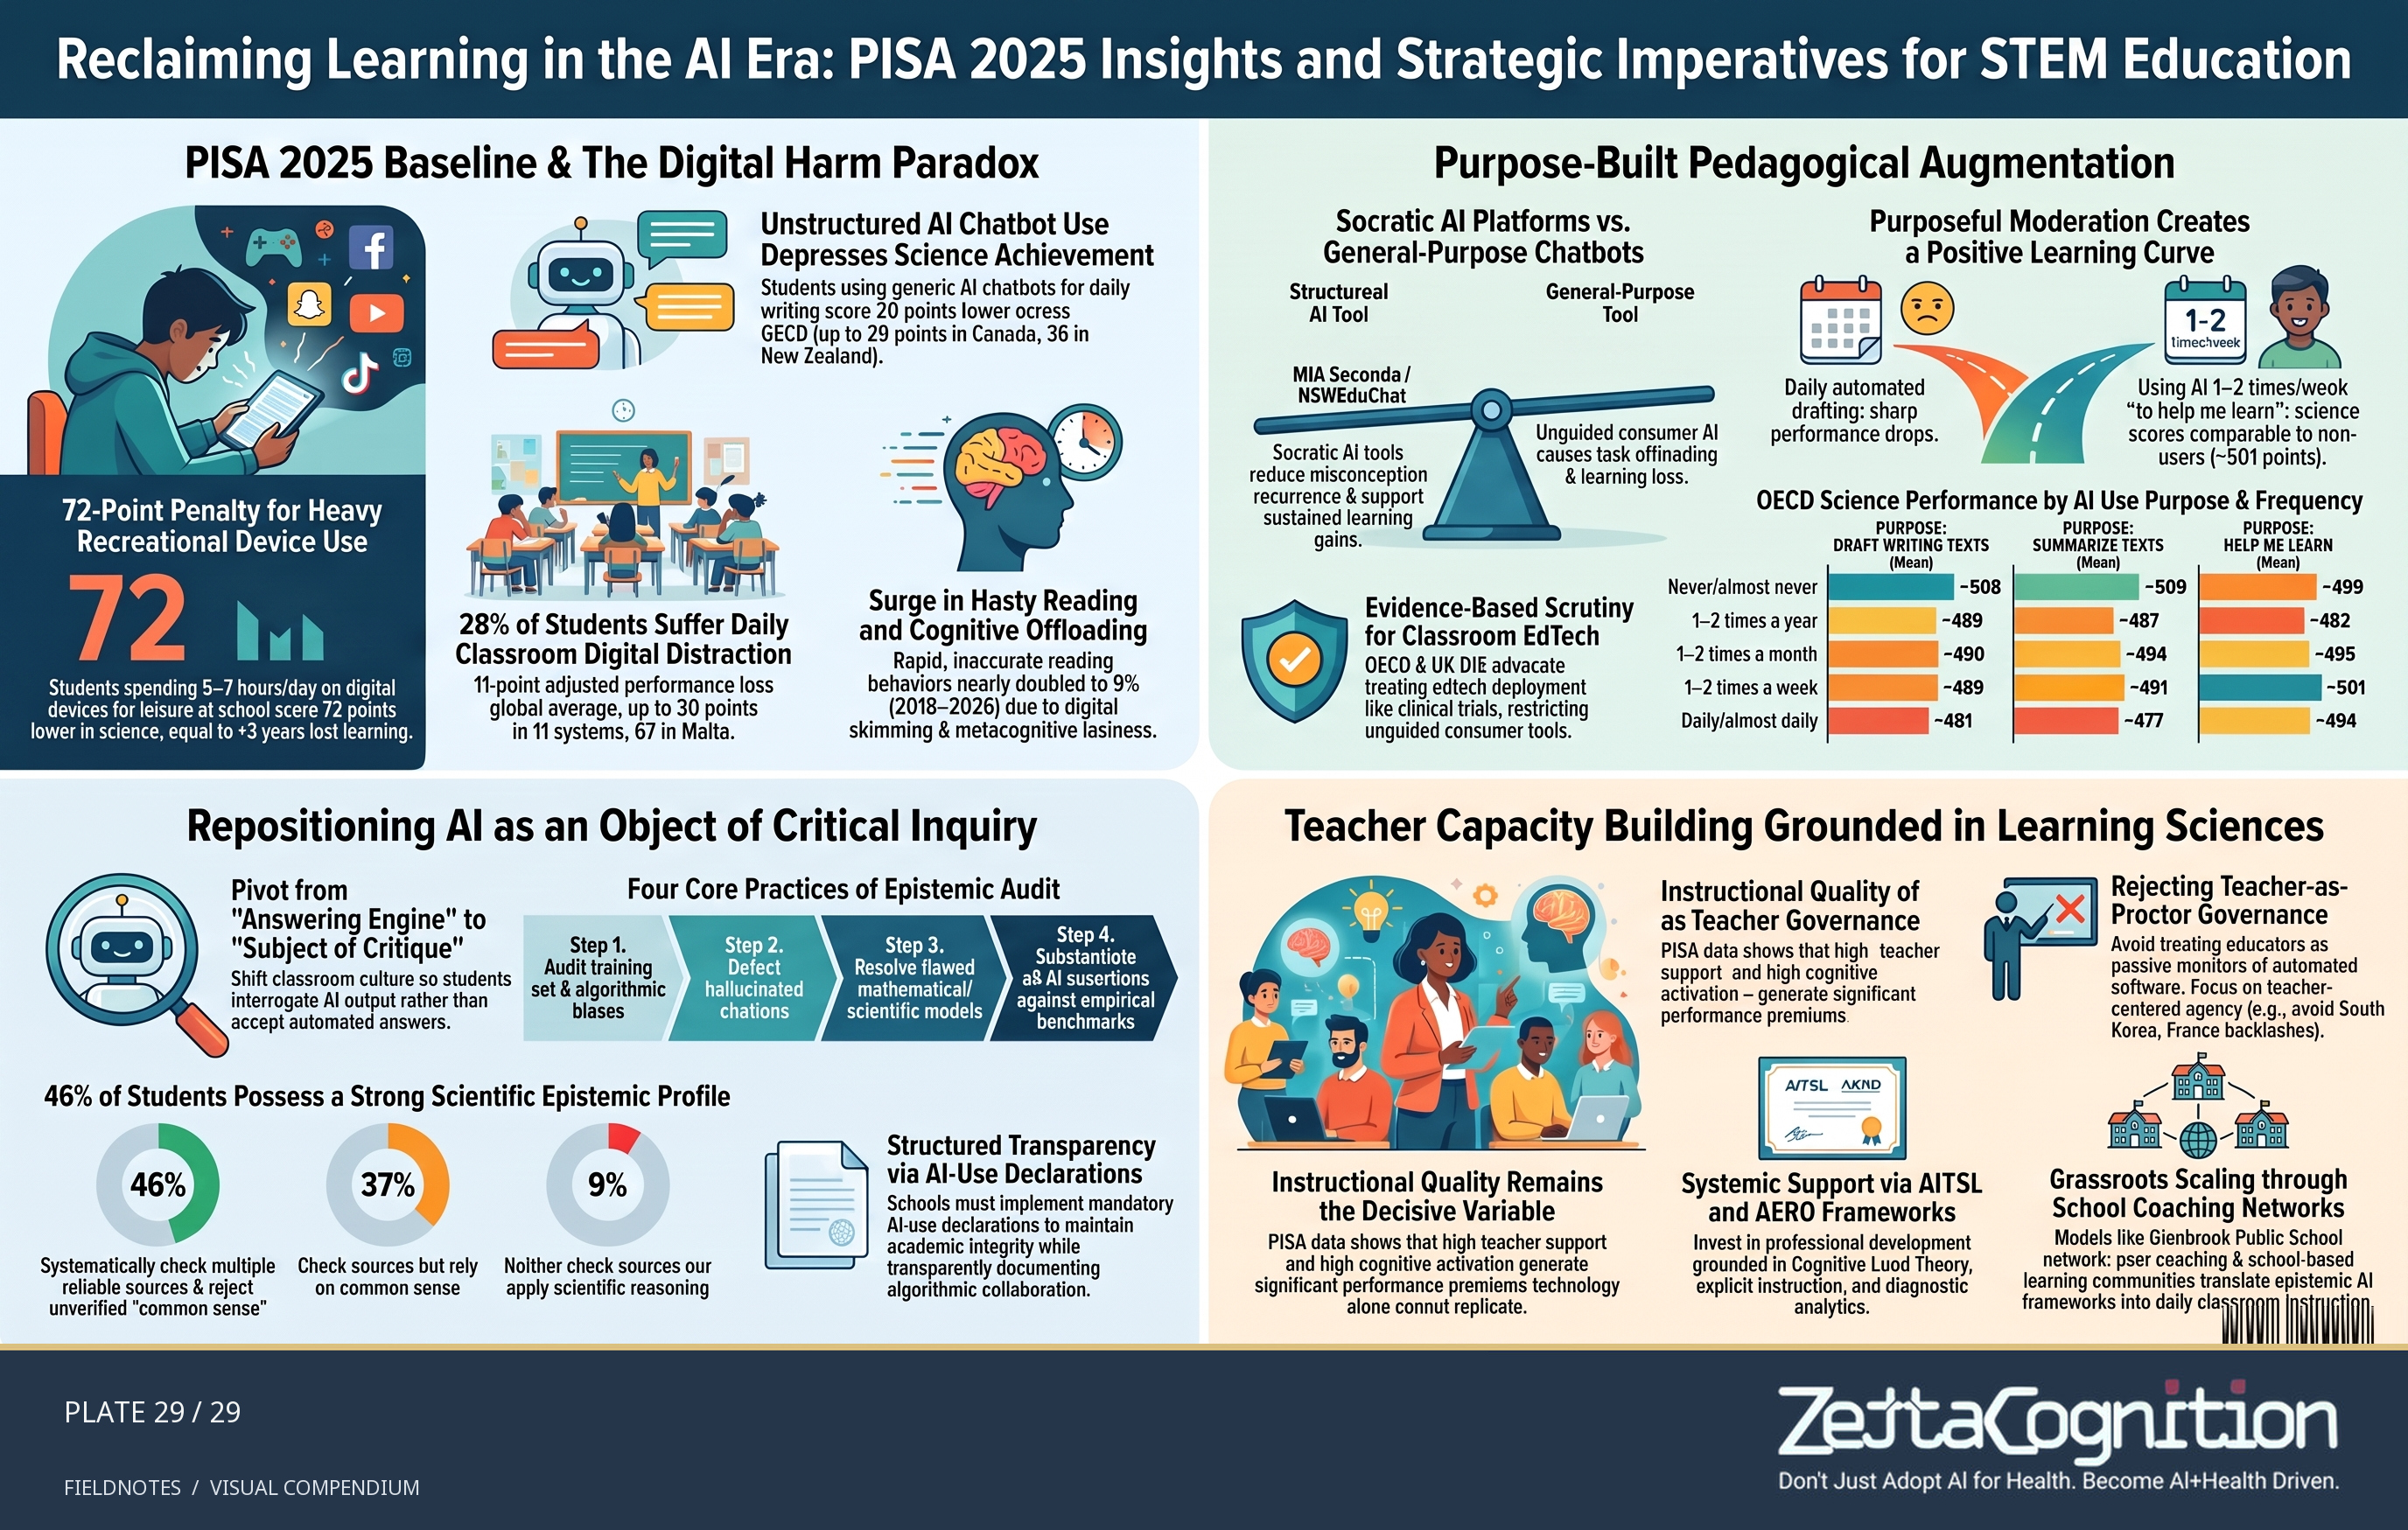
PISA 2025 STEM education
A research illustration connecting critical inquiry, pedagogical AI and teacher capacity. Numerical PISA claims, country comparisons and score penalties in the original artwork are not independently verified here; read the linked story for qualifications.
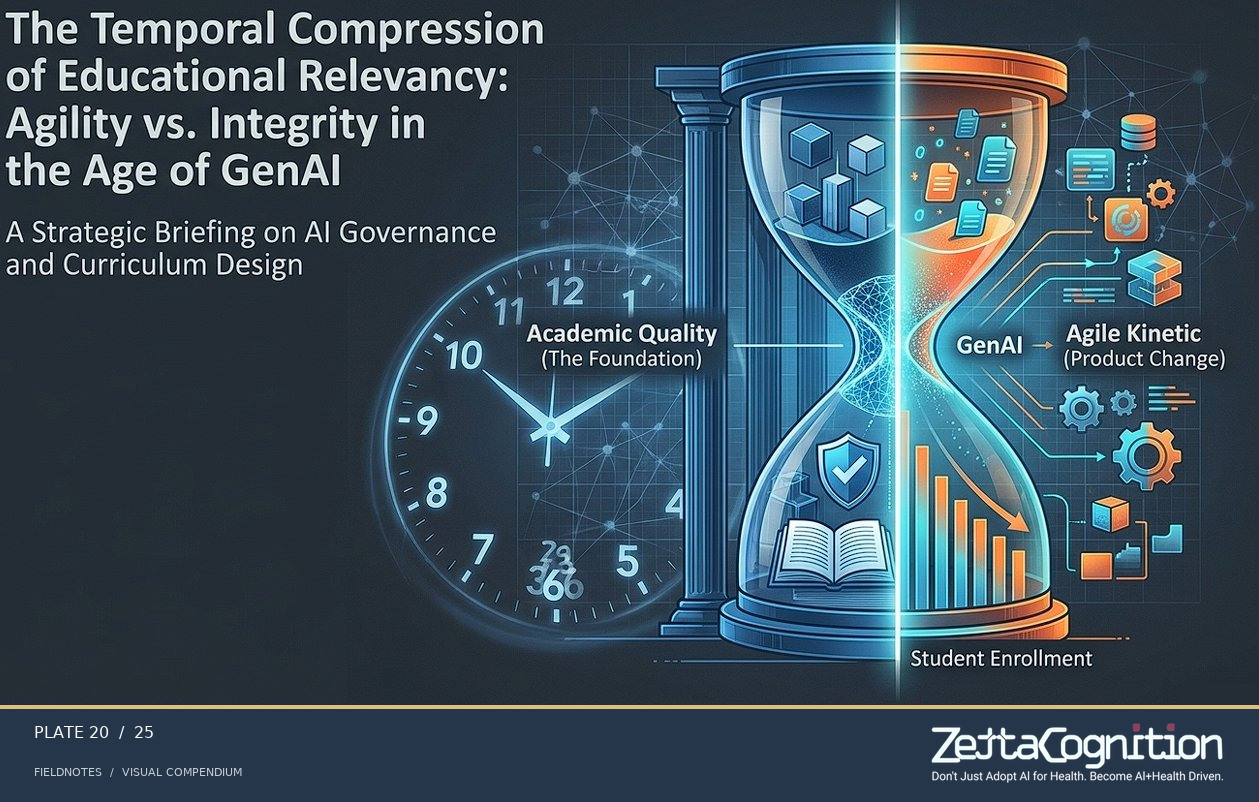
The compression of relevance
A visual argument for why course content needs a faster renewal cycle.
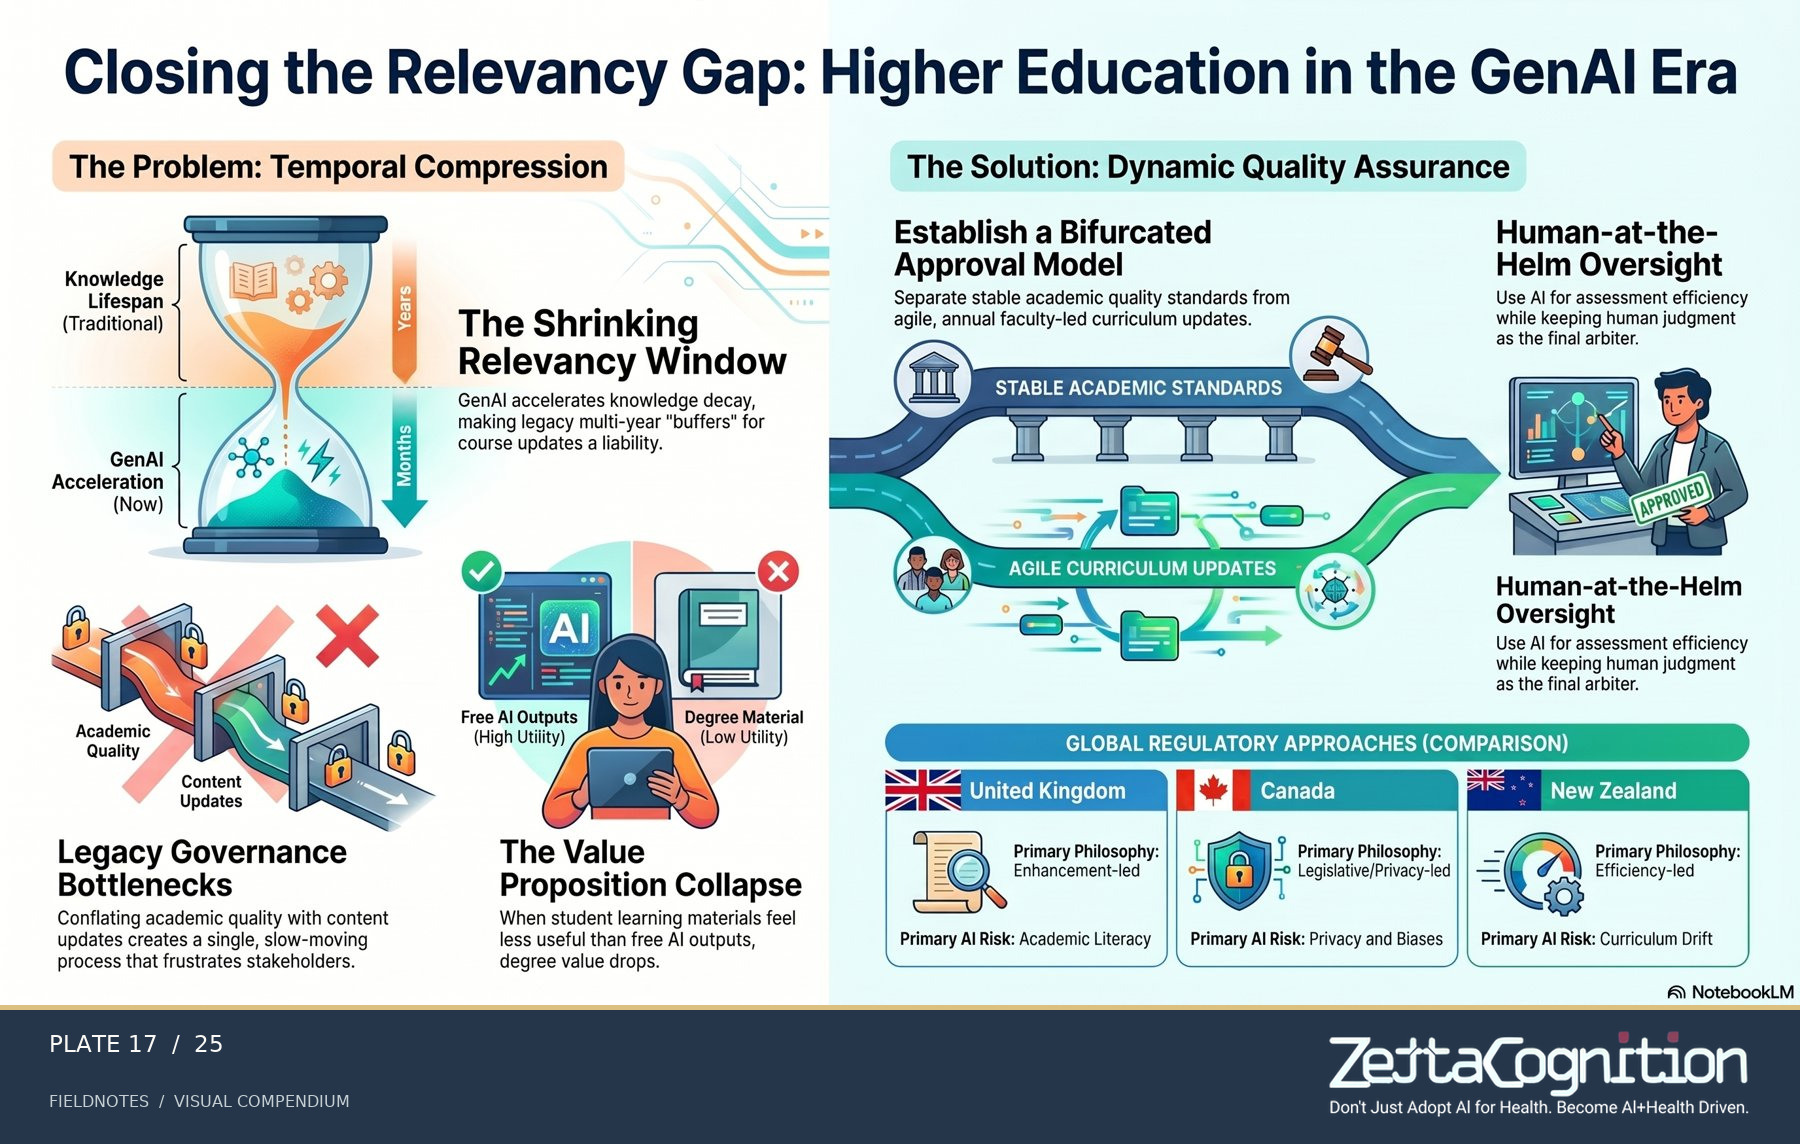
Closing the relevance gap
A proposed path from static syllabuses toward more agile learning.
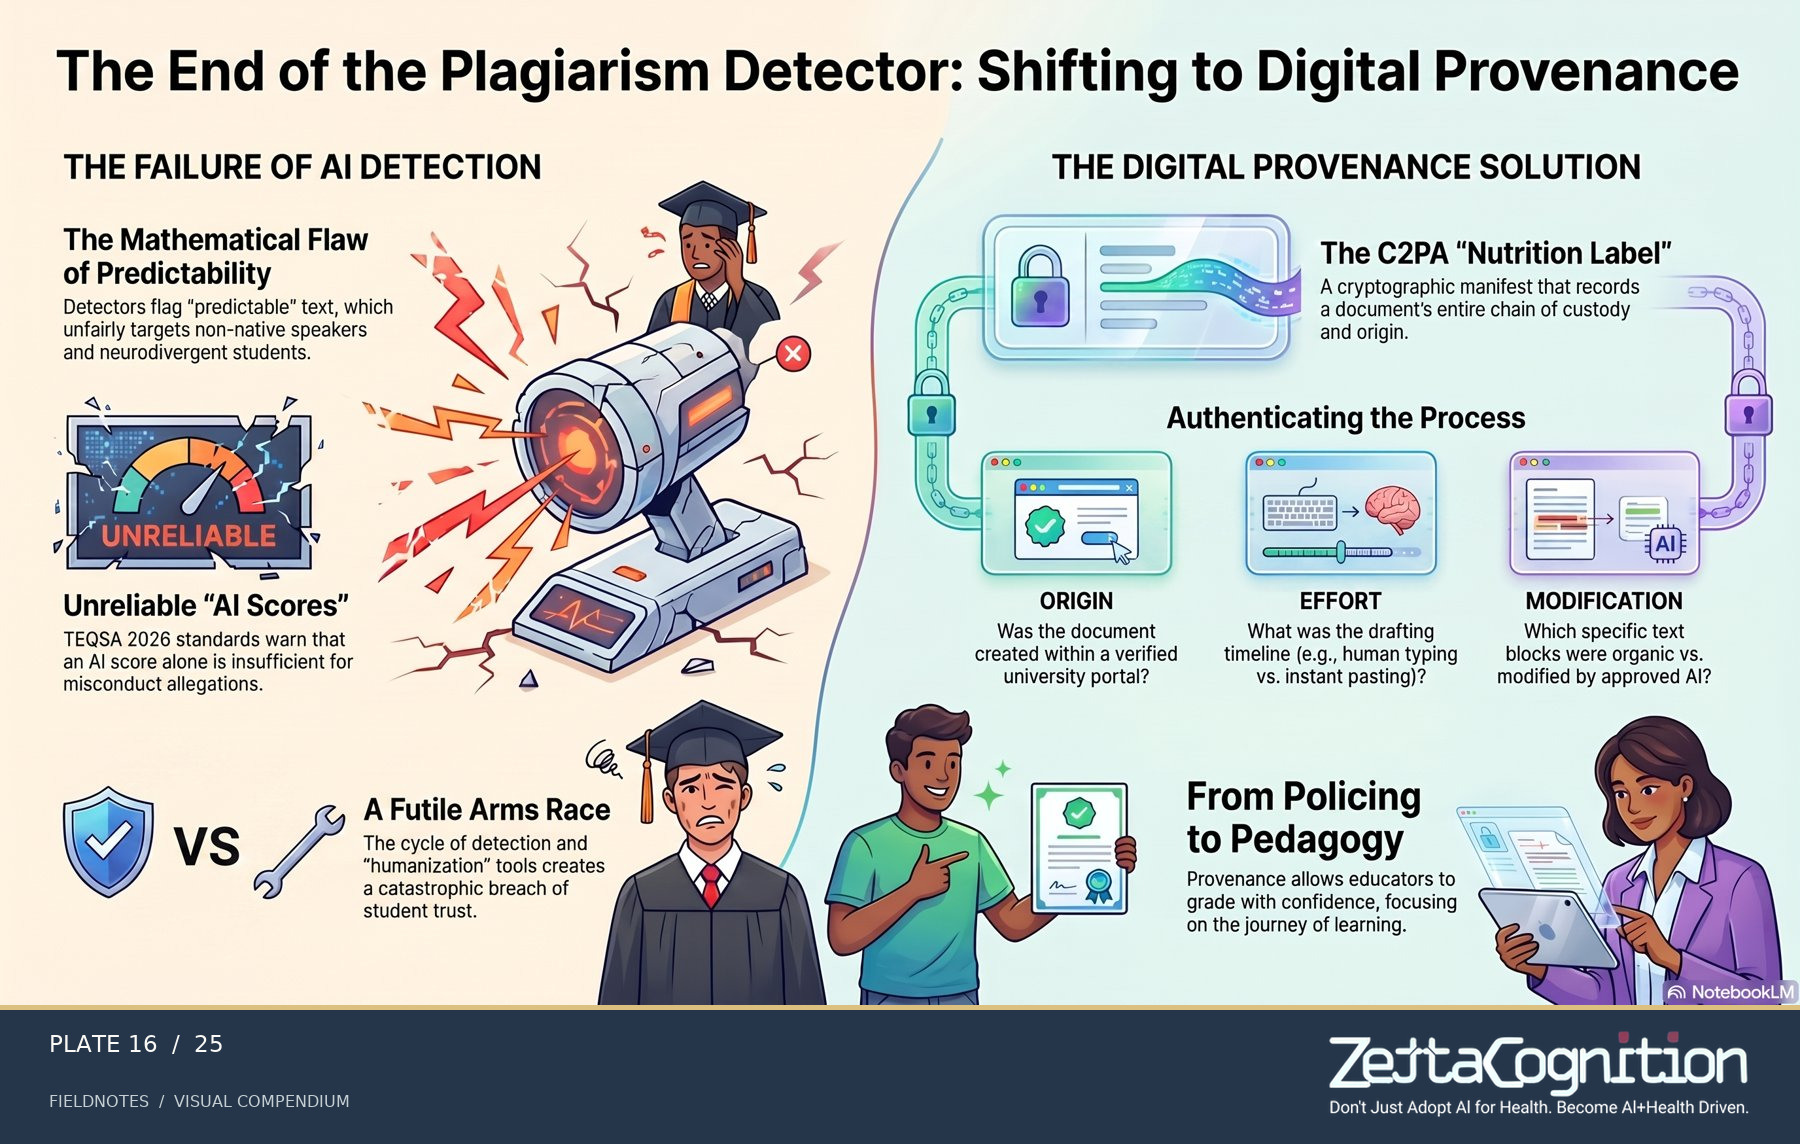
Beyond the plagiarism detector
A shift from trying to detect AI use toward showing the provenance of work.
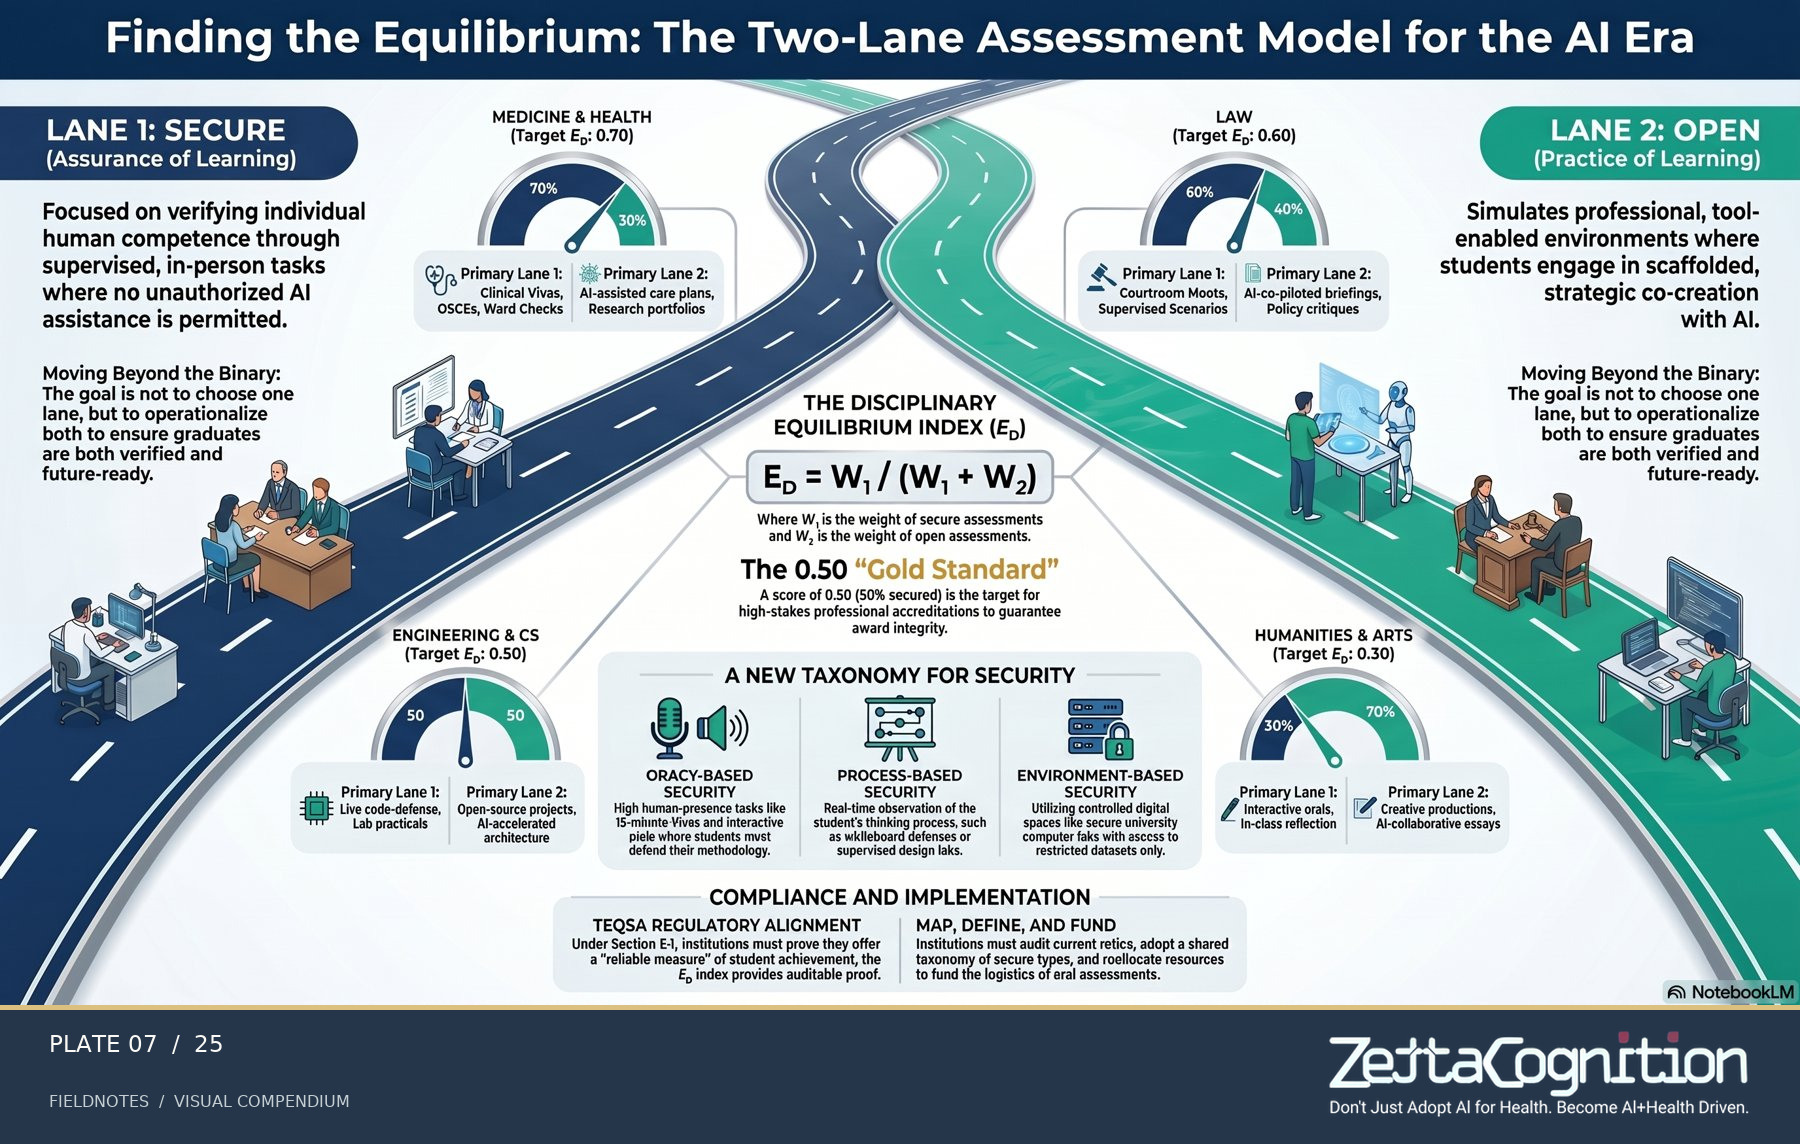
The two-lane assessment model
Secure checks and open, tool-rich practice answer different questions about capability.
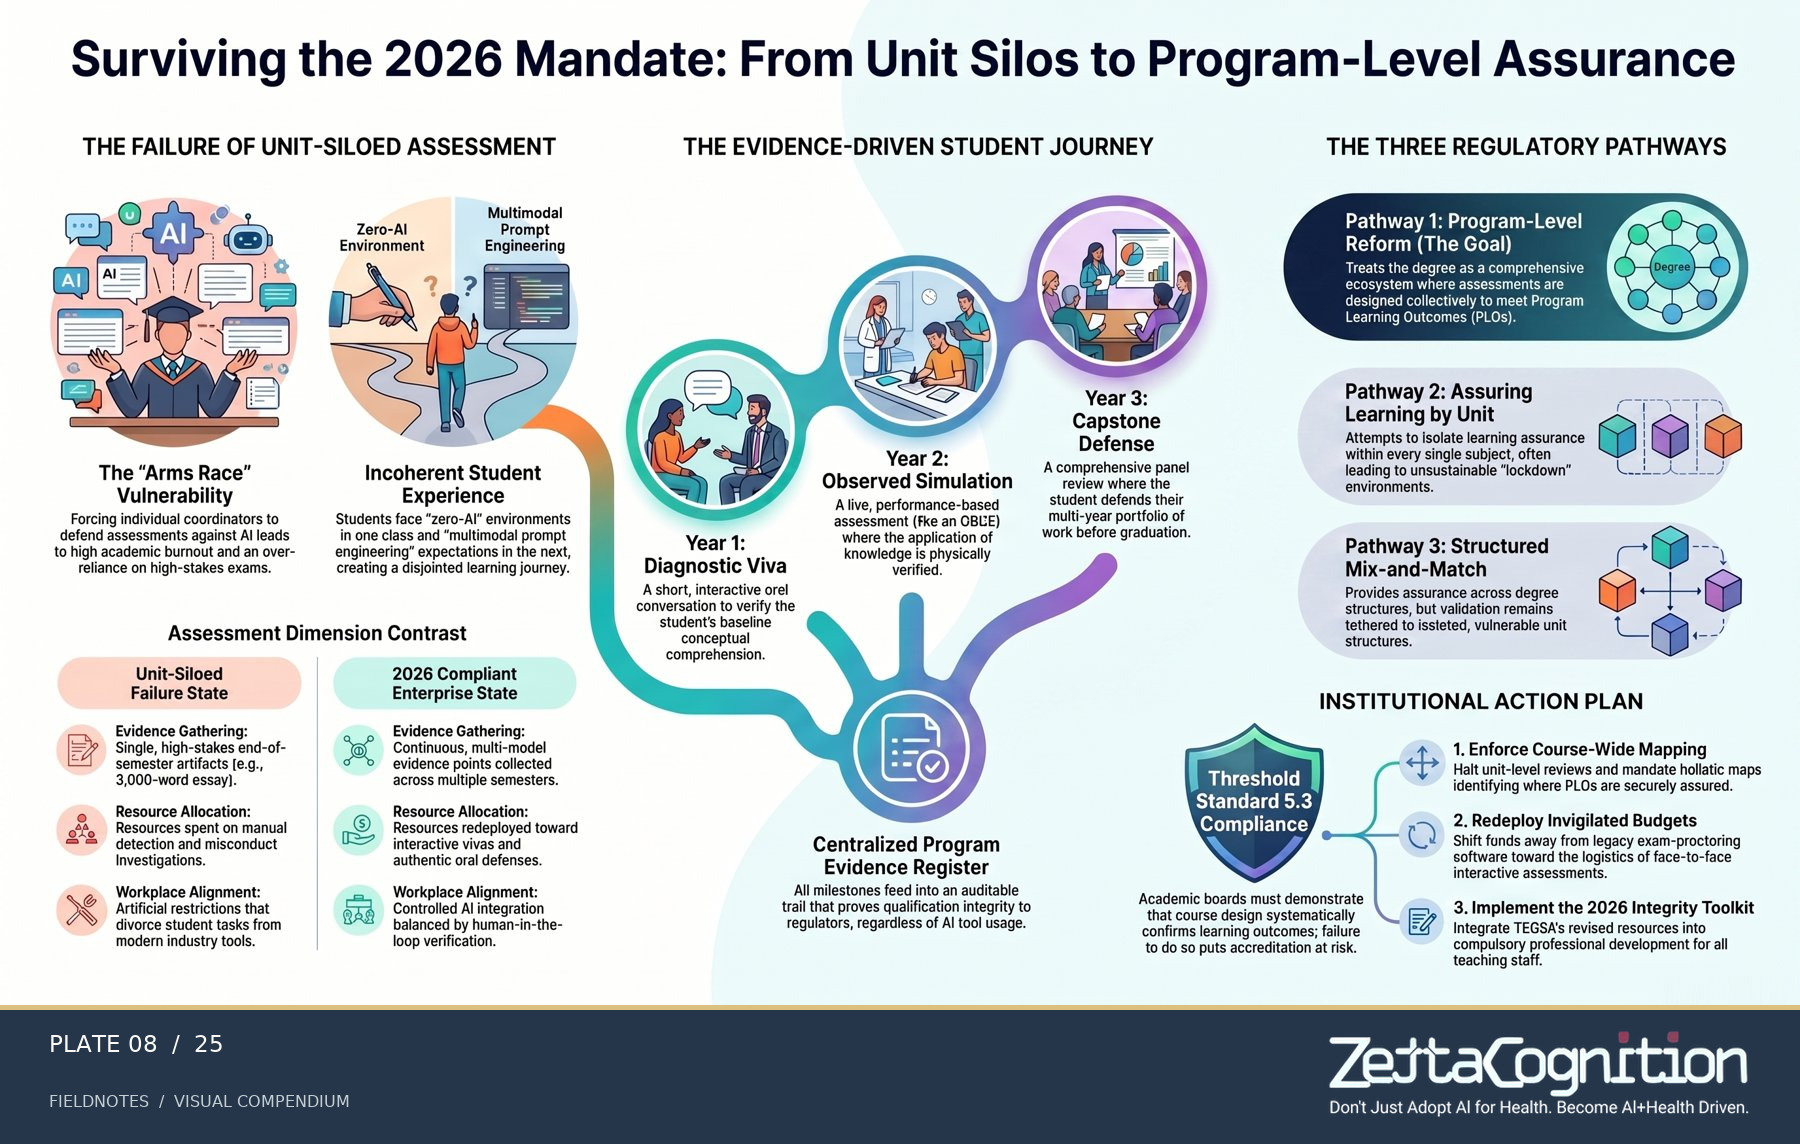
From silos to assurance
A program-level view of evidence, standards and learning outcomes.
A better assessment is only useful if the institution can tell whether its promises are being kept over time.
Keep seeing what is true.
A review every few years can miss what happens between reviews. These visual frameworks explore continuous evidence, responsibility and changing standards. References to 2026 frameworks are presented as research proposals and commentary, not official regulatory advice.
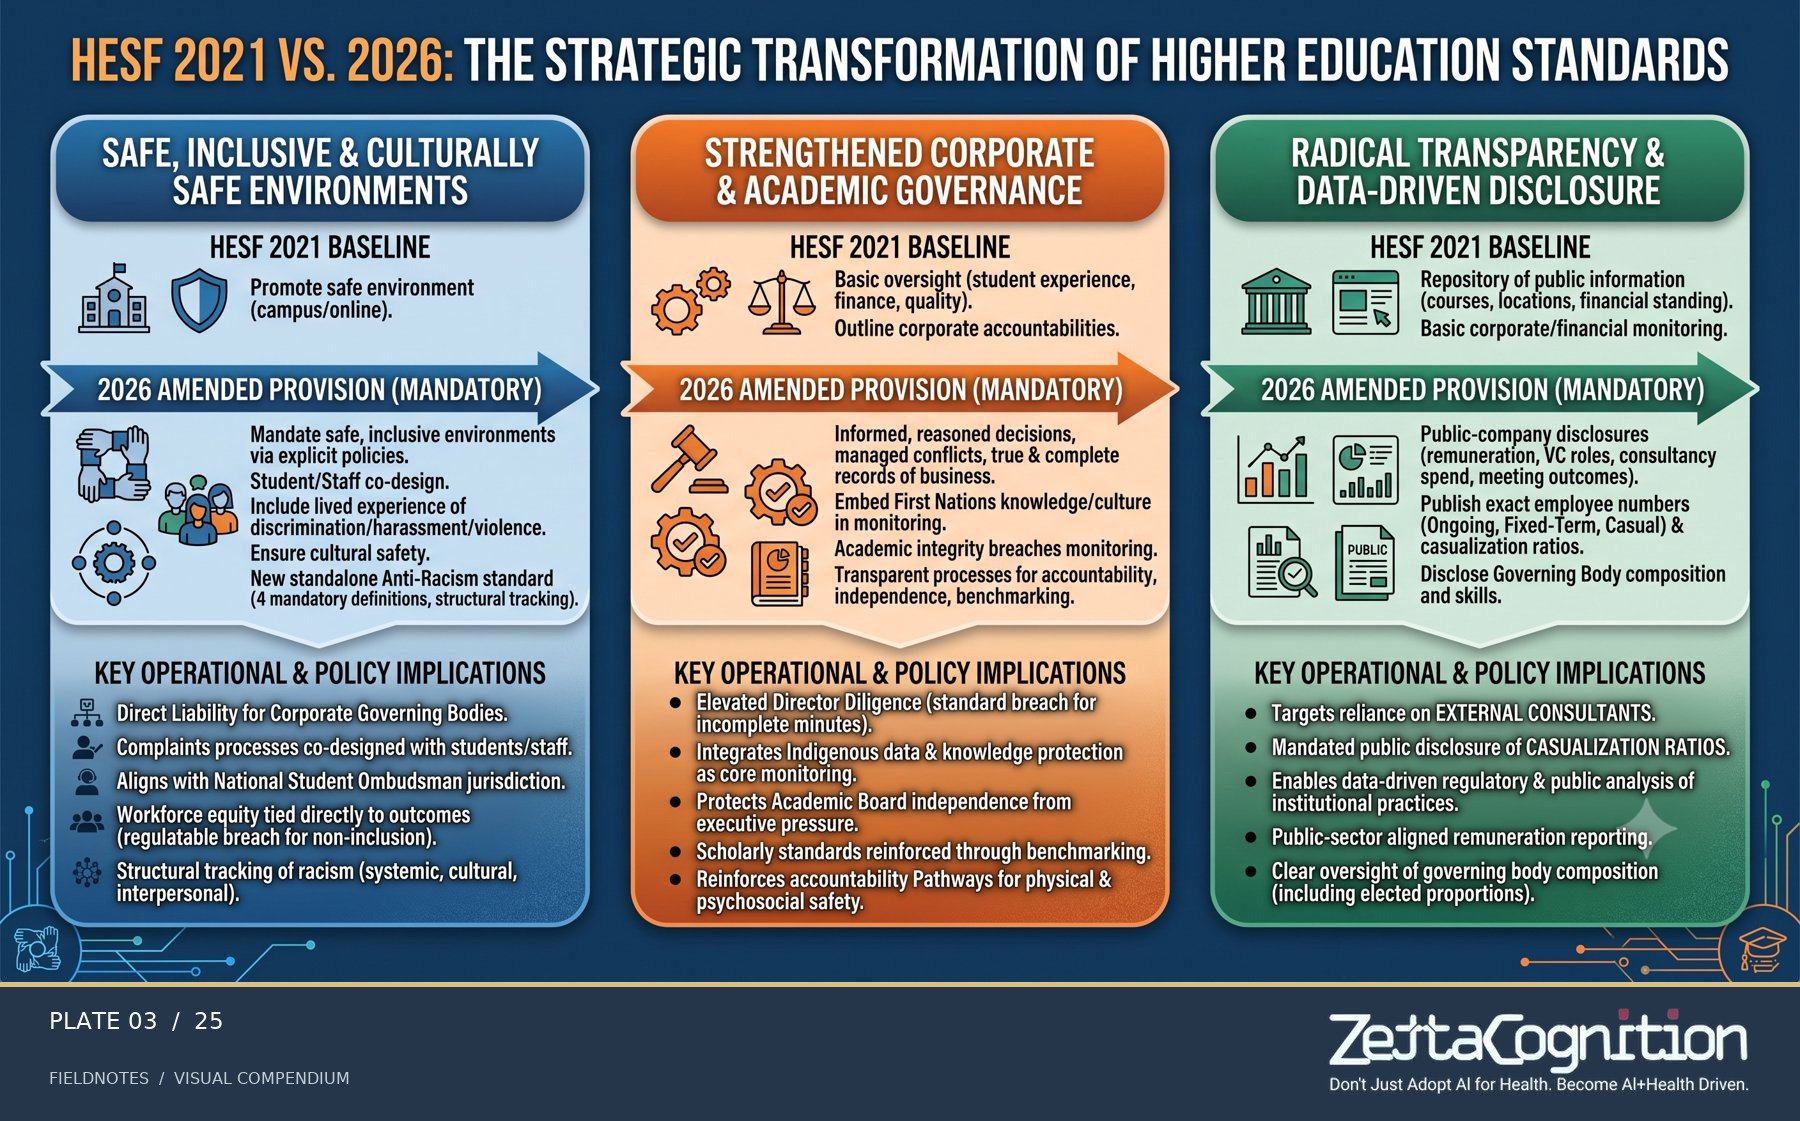
Higher education standards in transition
An interpretation of changing expectations for institutional quality.
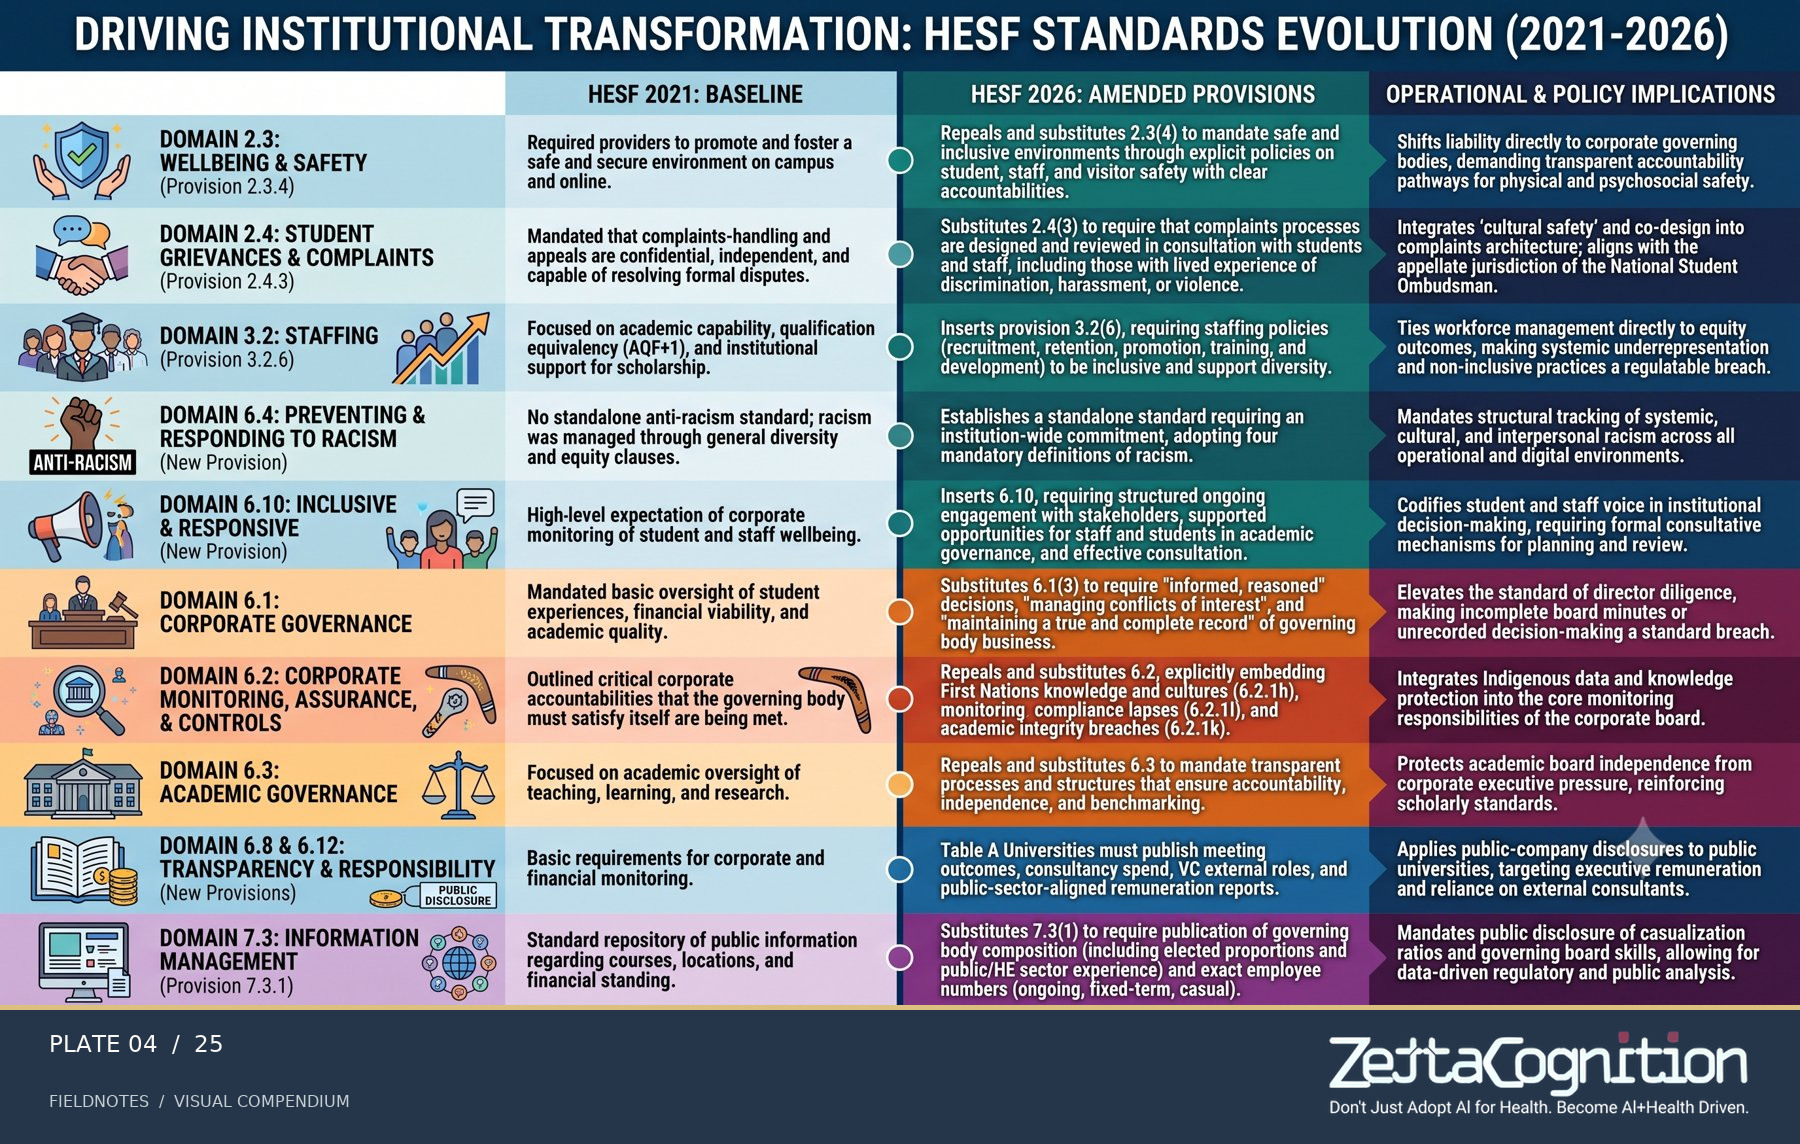
A side-by-side standards view
Comparing proposed shifts in practice across institutional functions.
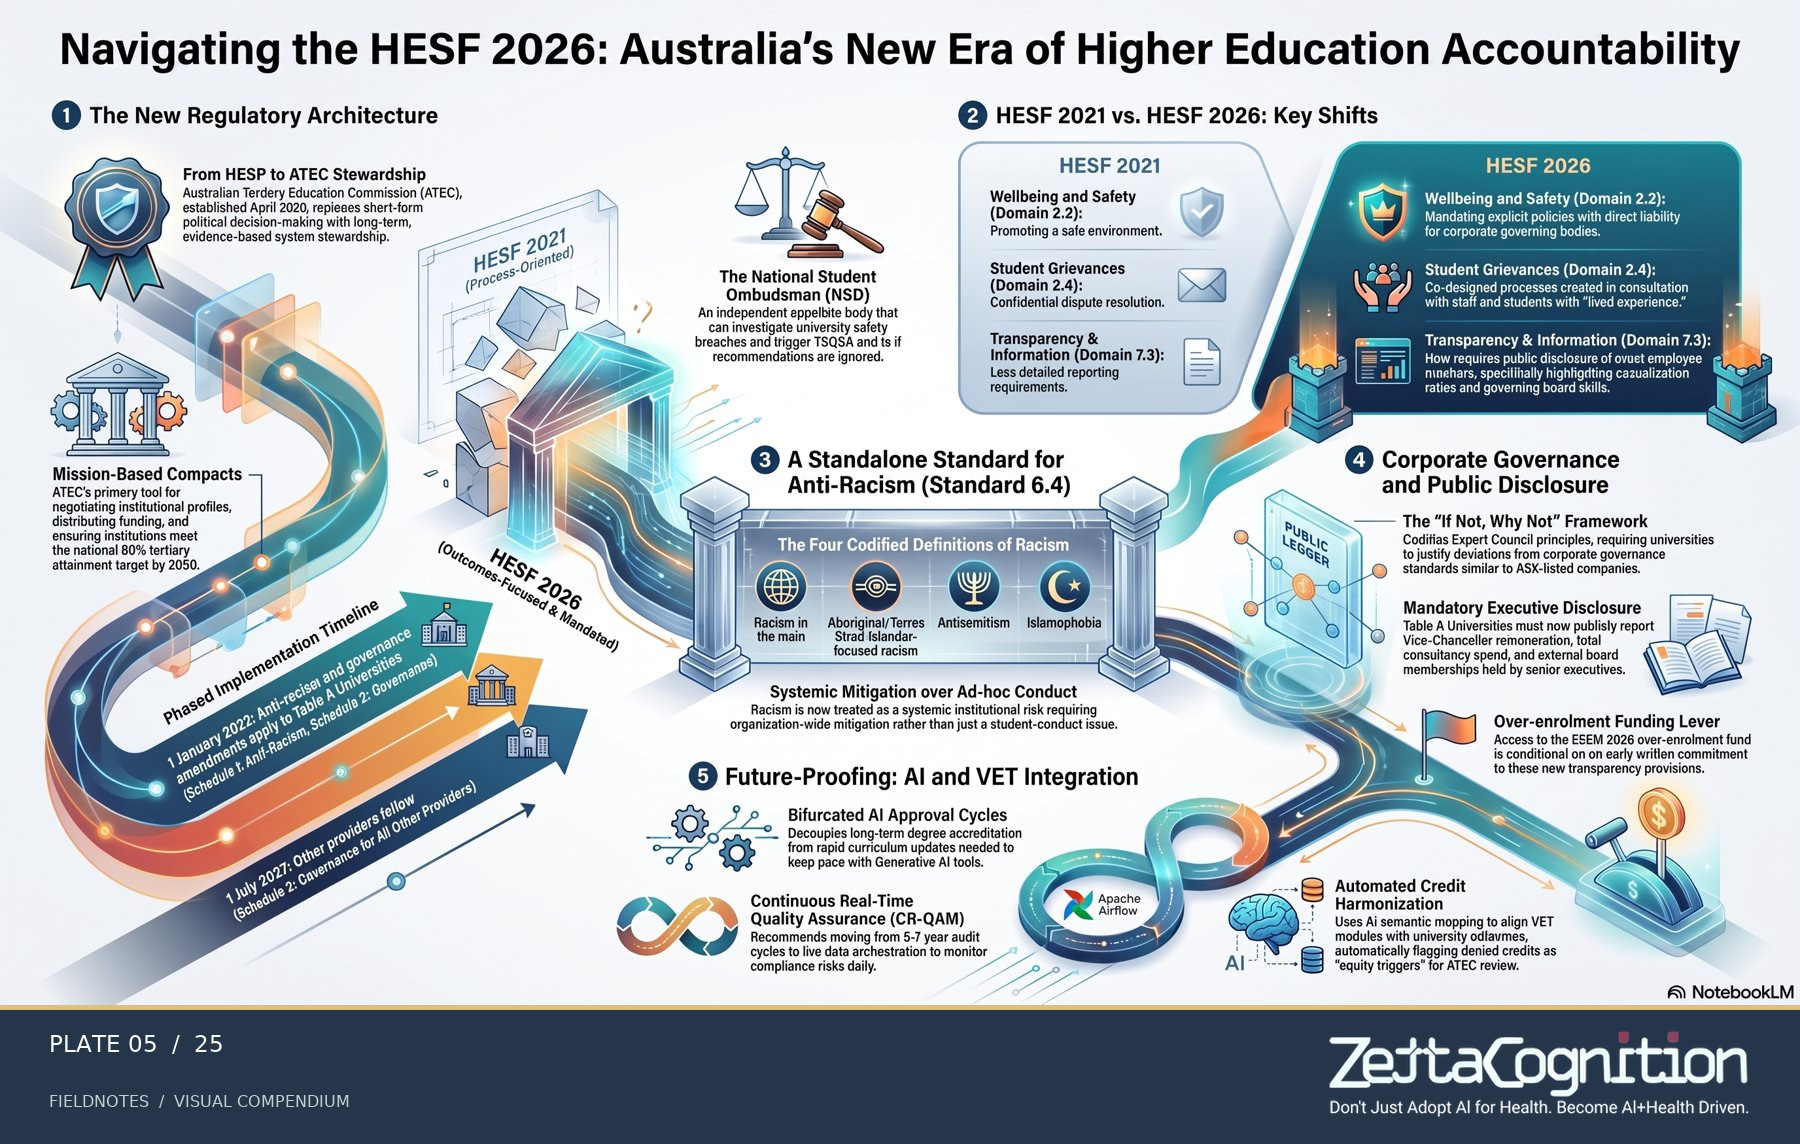
The accountability journey
A visual route from institutional intent to documented responsibility.
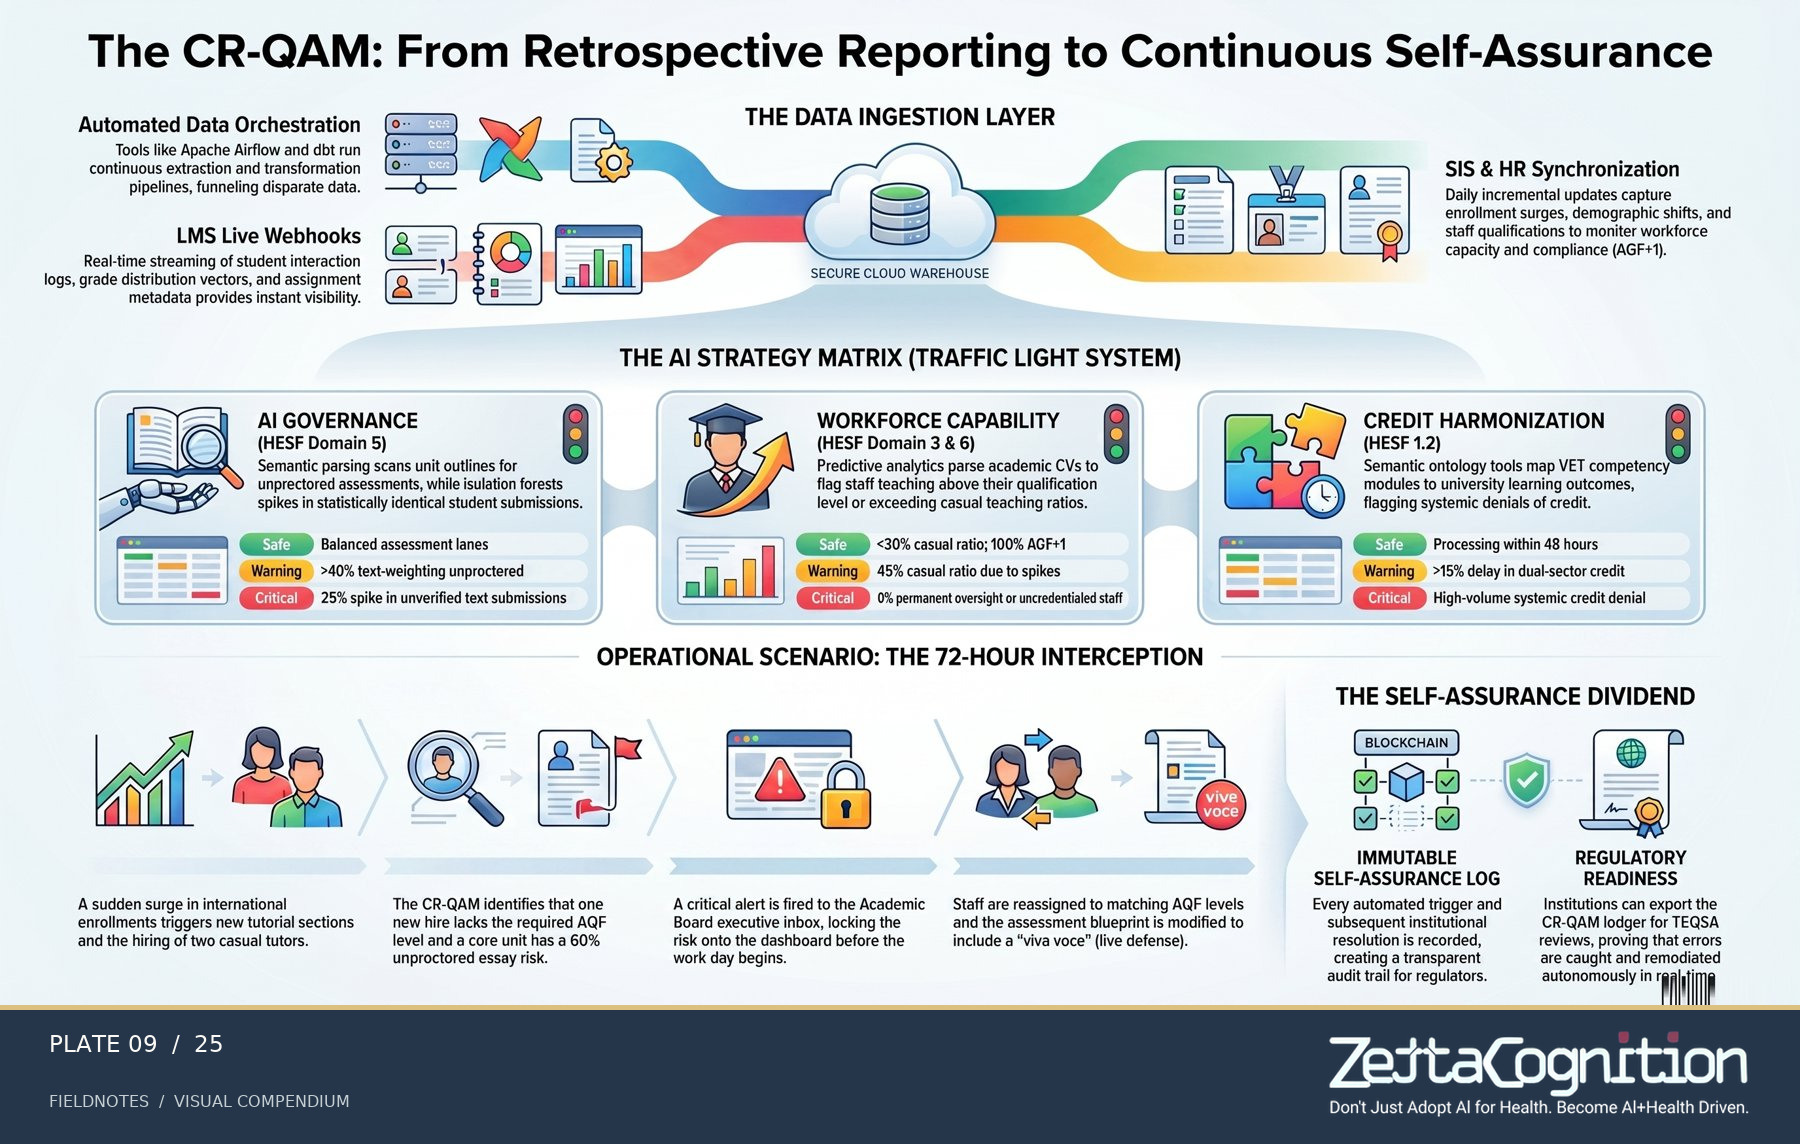
Continuous quality assurance
A framework connecting signals, review and decisions while there is still time to act.
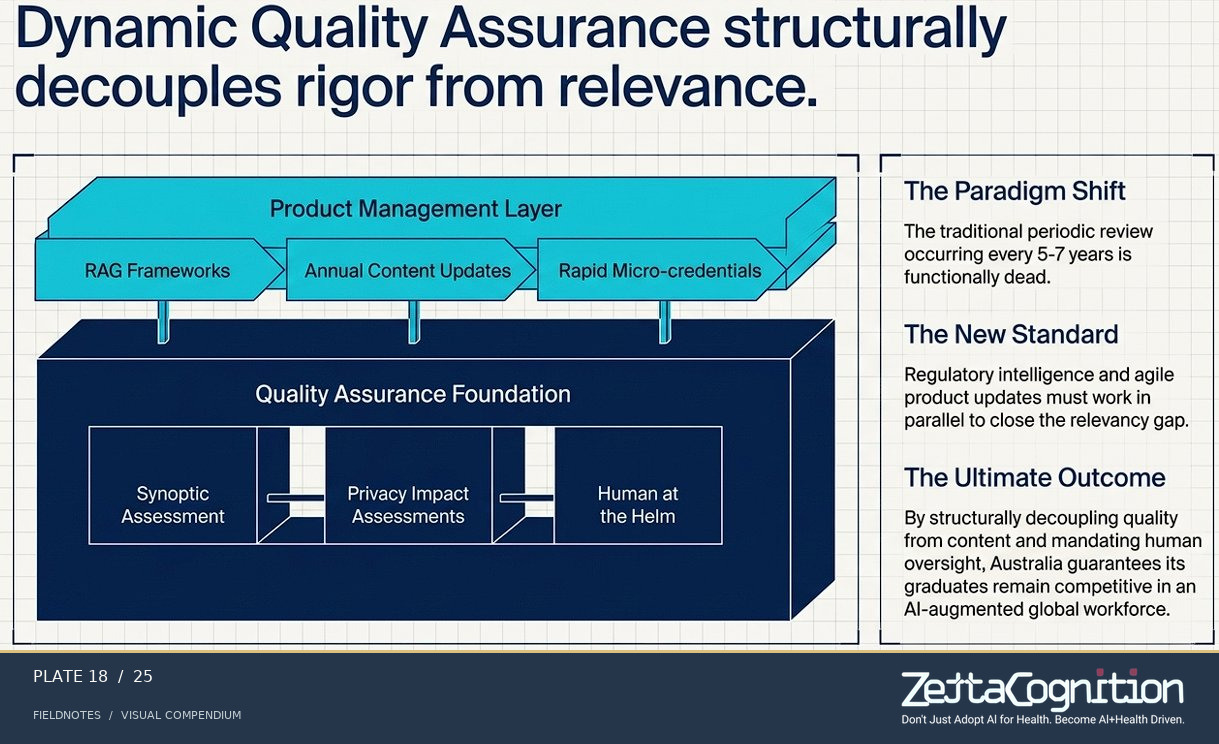
Dynamic quality assurance
A compact structural diagram of feedback across program and institution.
Assurance is not an end in itself. Its value lies in whether it opens more coherent, accessible paths for learners and workers.
Make the system serve people.
The final question is not which tool wins. It is whether people can move between education and work, gain recognition for what they know, and receive care shaped by their actual circumstances.
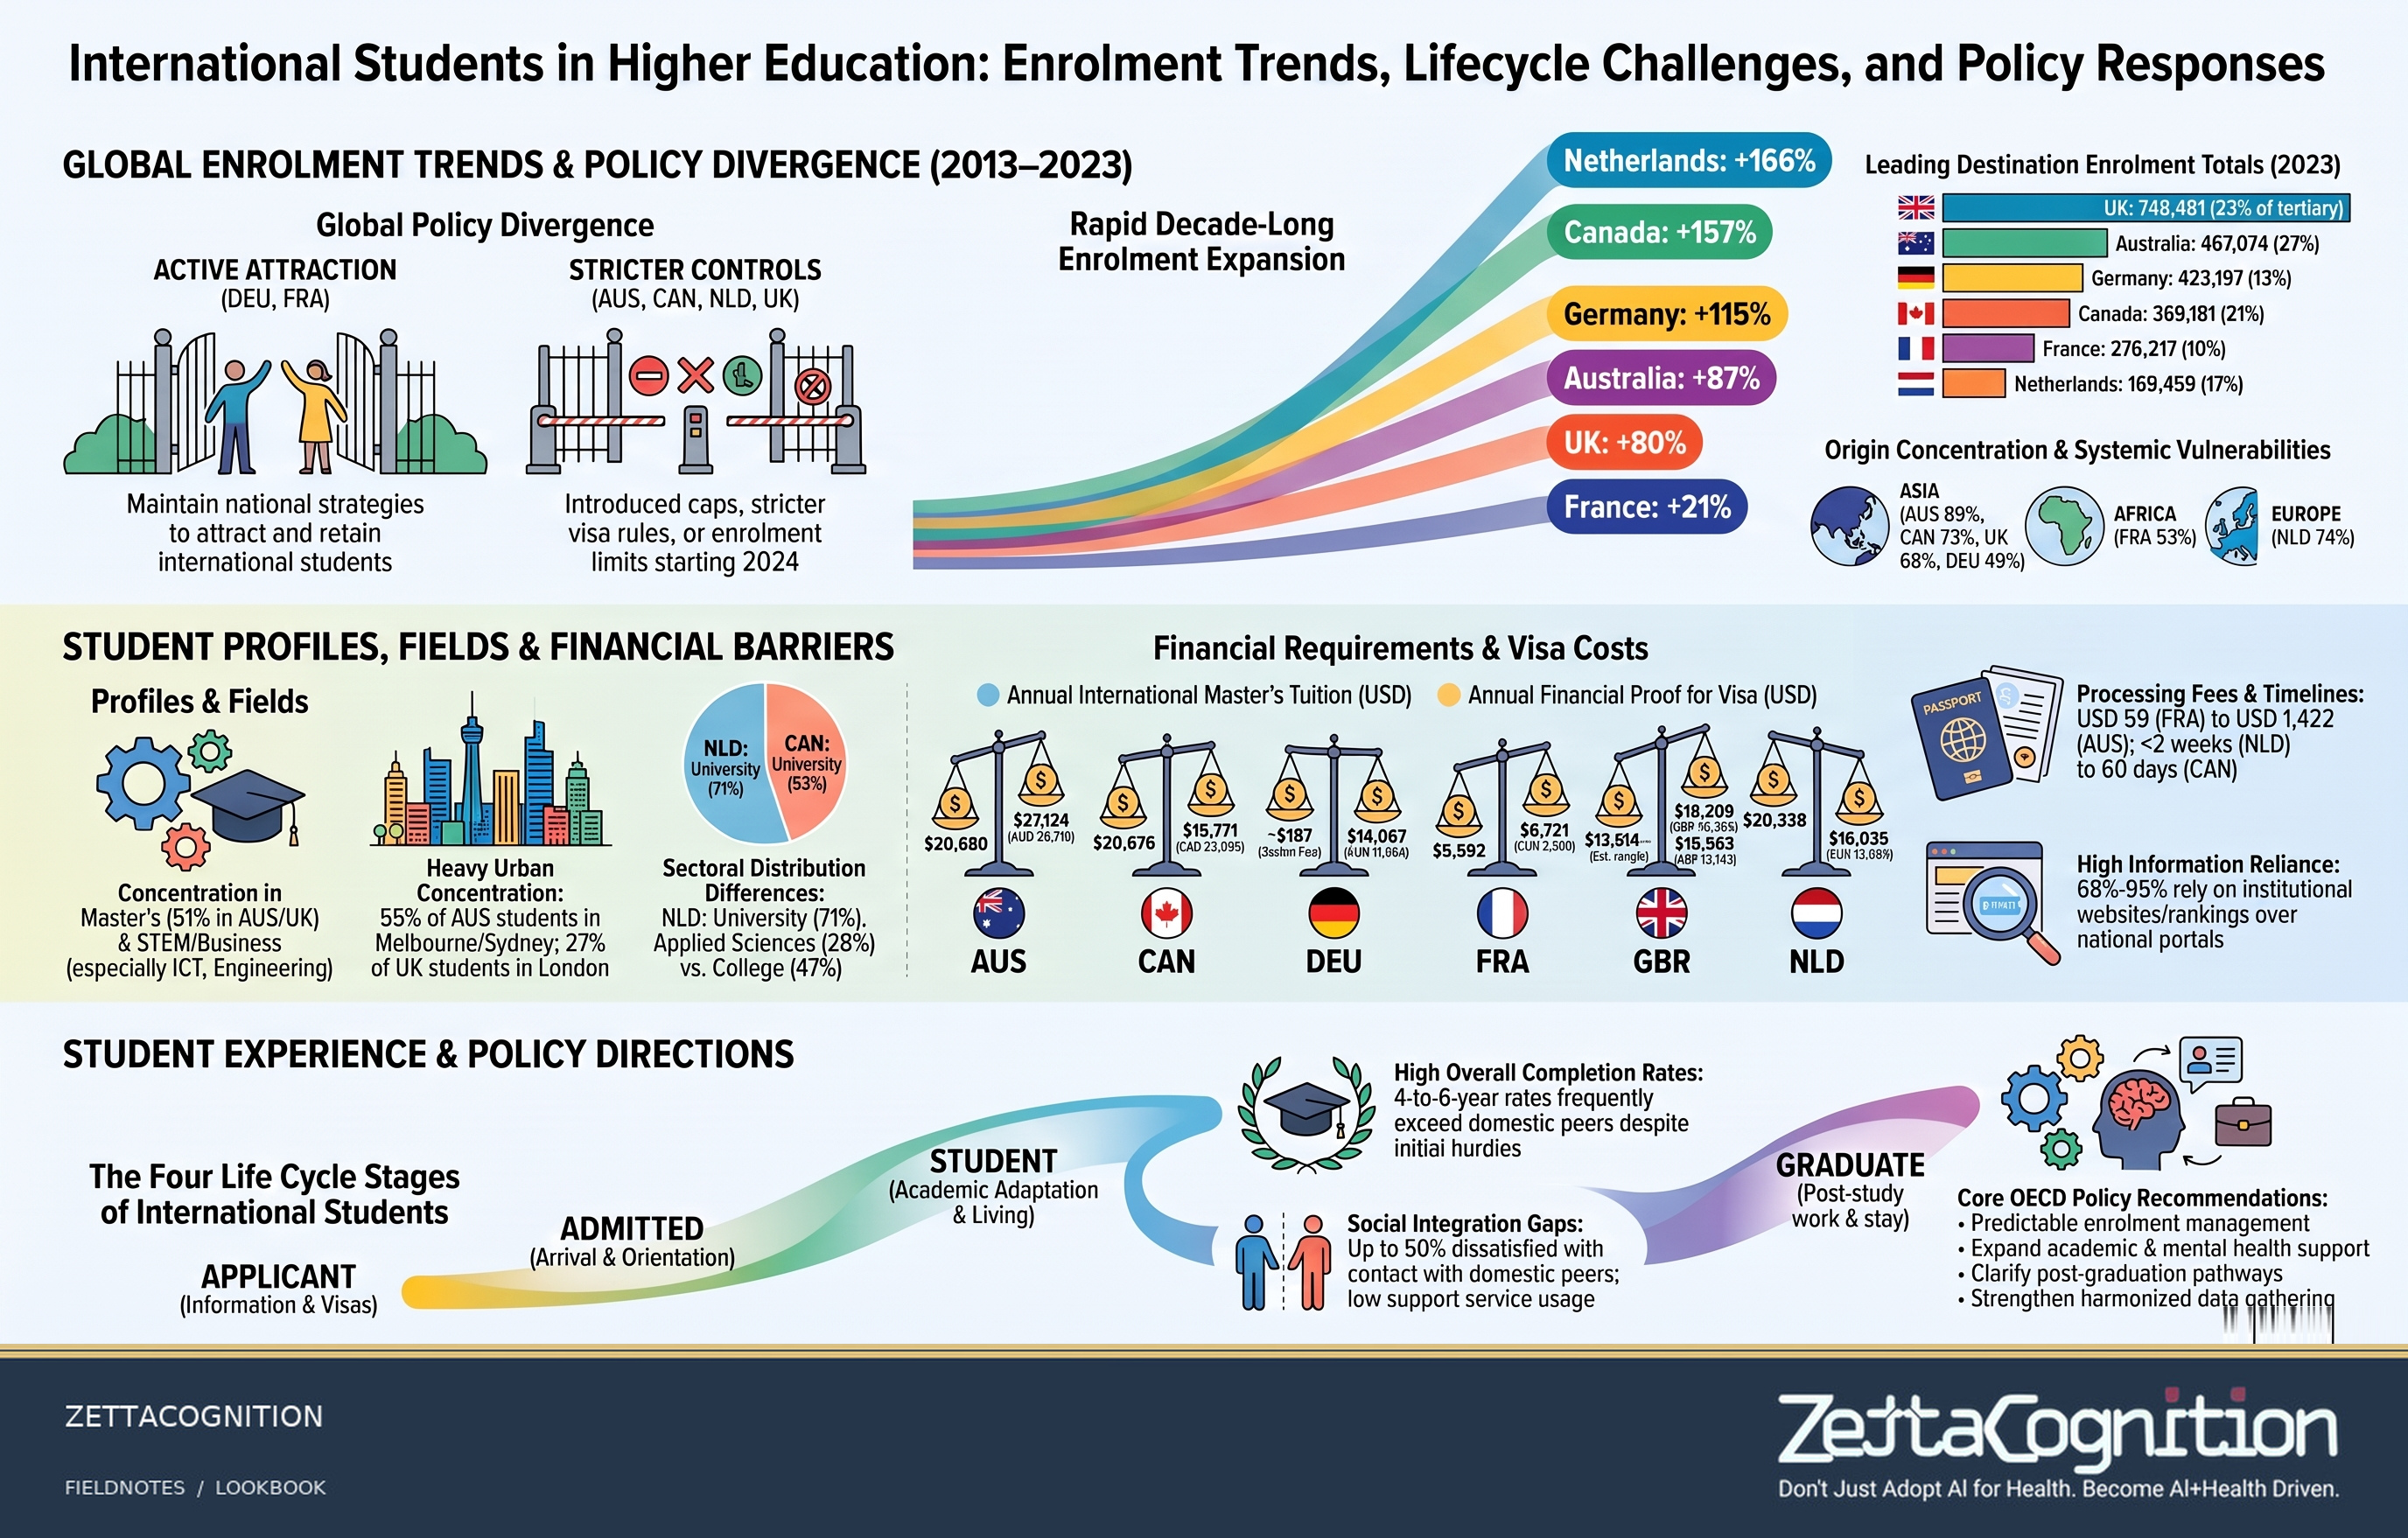
International higher education student trends
A research overview of mobility, institutional funding and the student journey. Country figures, fees and policy labels in the original artwork are not independently verified here; consult the linked story and current official rules.
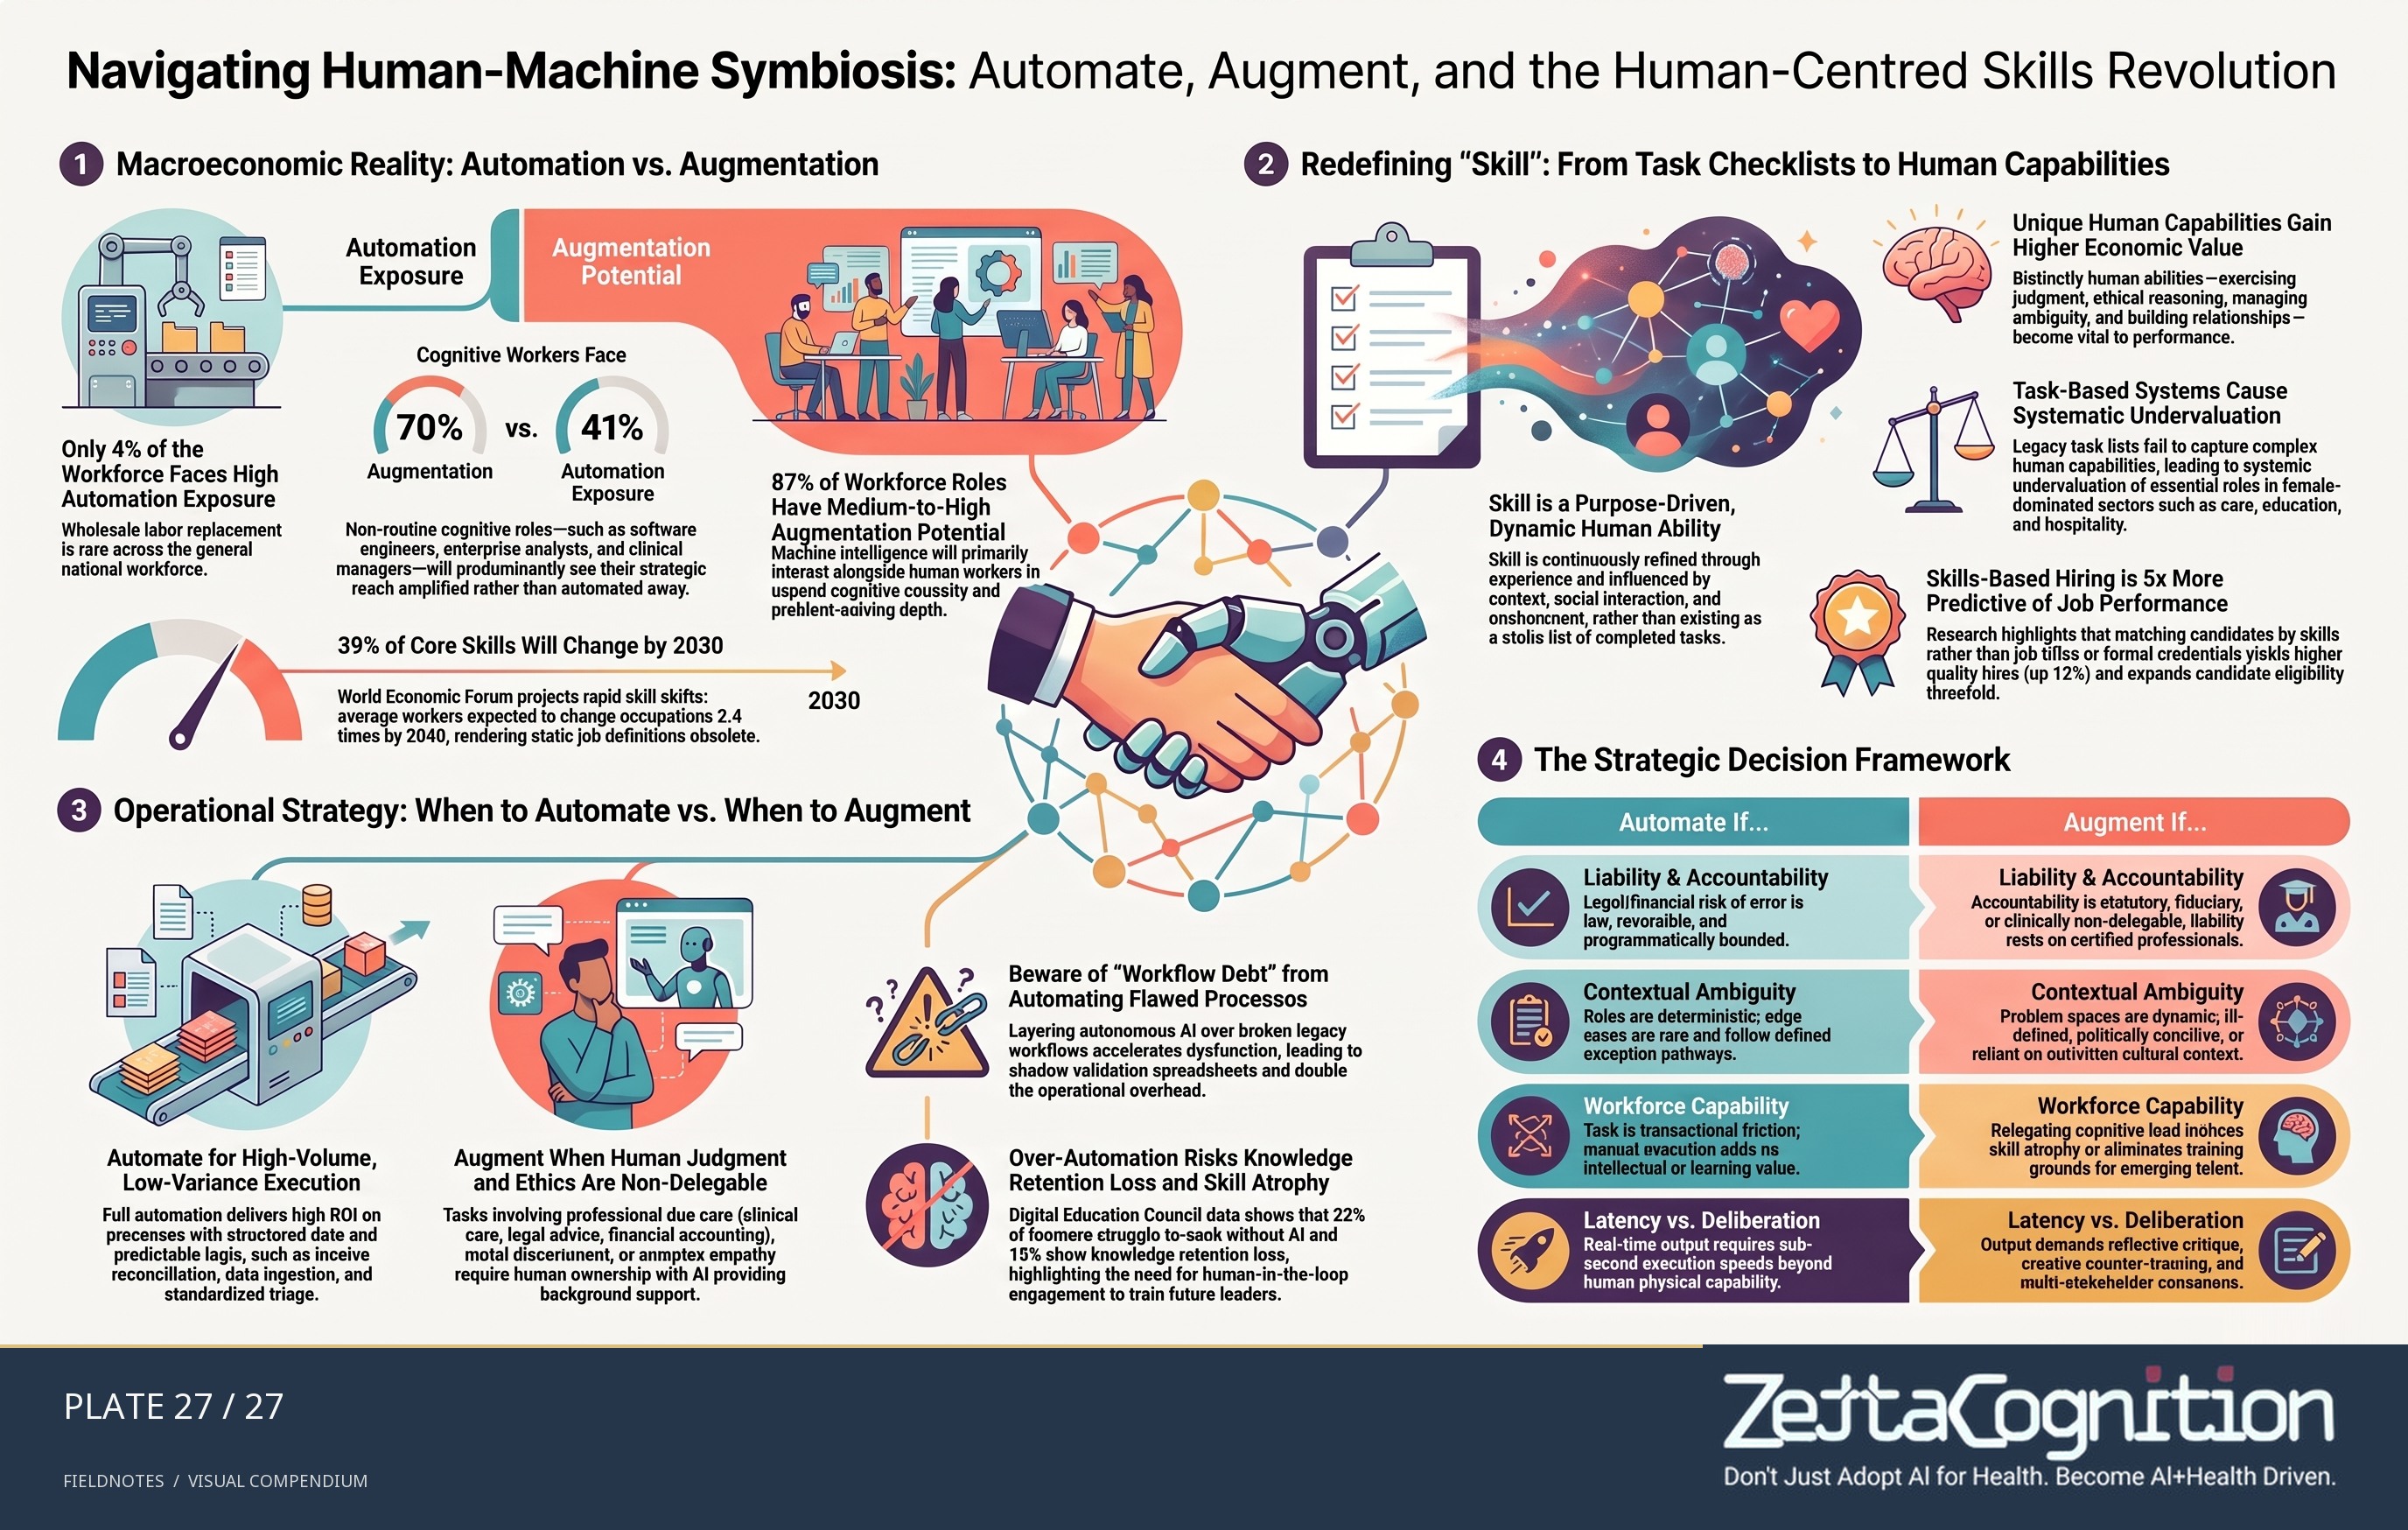
Navigating human-machine symbiosis
An illustrative decision map for automating repeatable work while augmenting work that depends on human judgement, capability and accountability. Its numerical claims belong to the source graphic and have not been independently verified here.
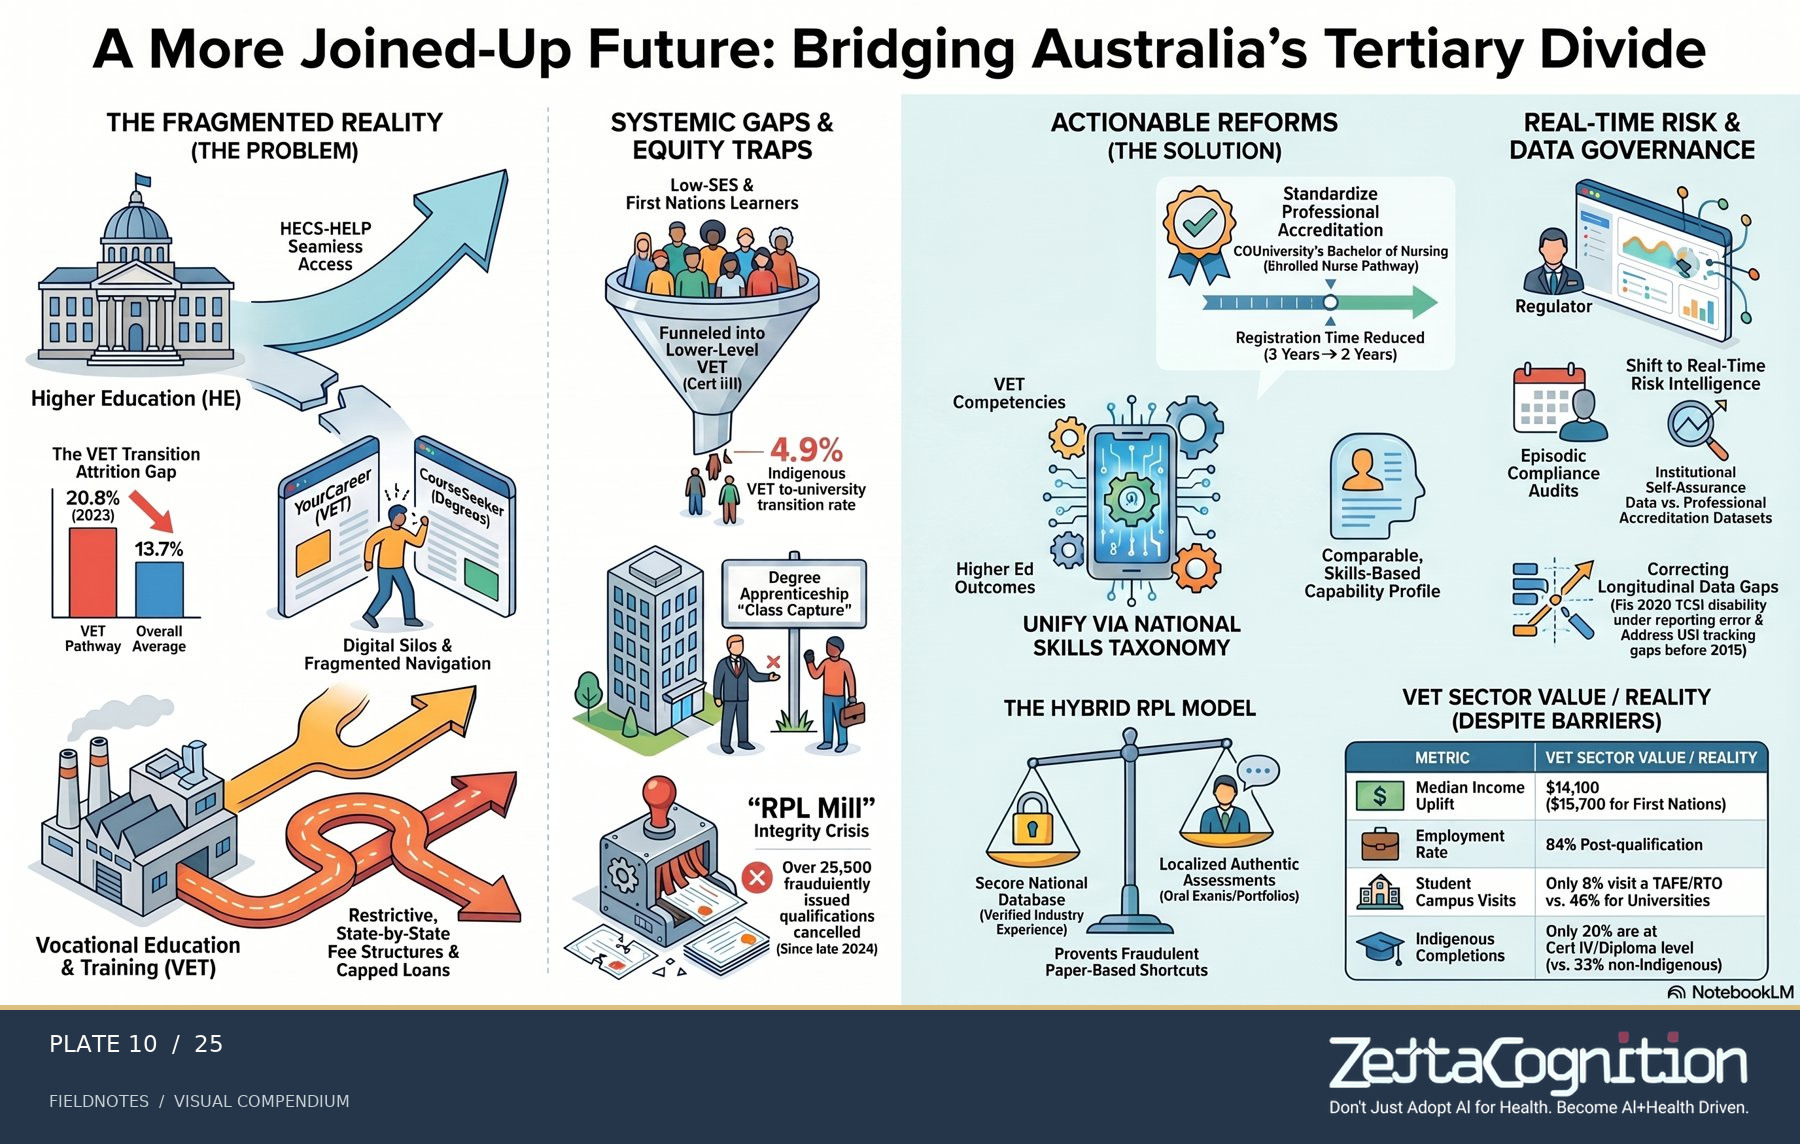
Bridging the tertiary divide
A vision for connecting fragmented learning routes and widening opportunity.
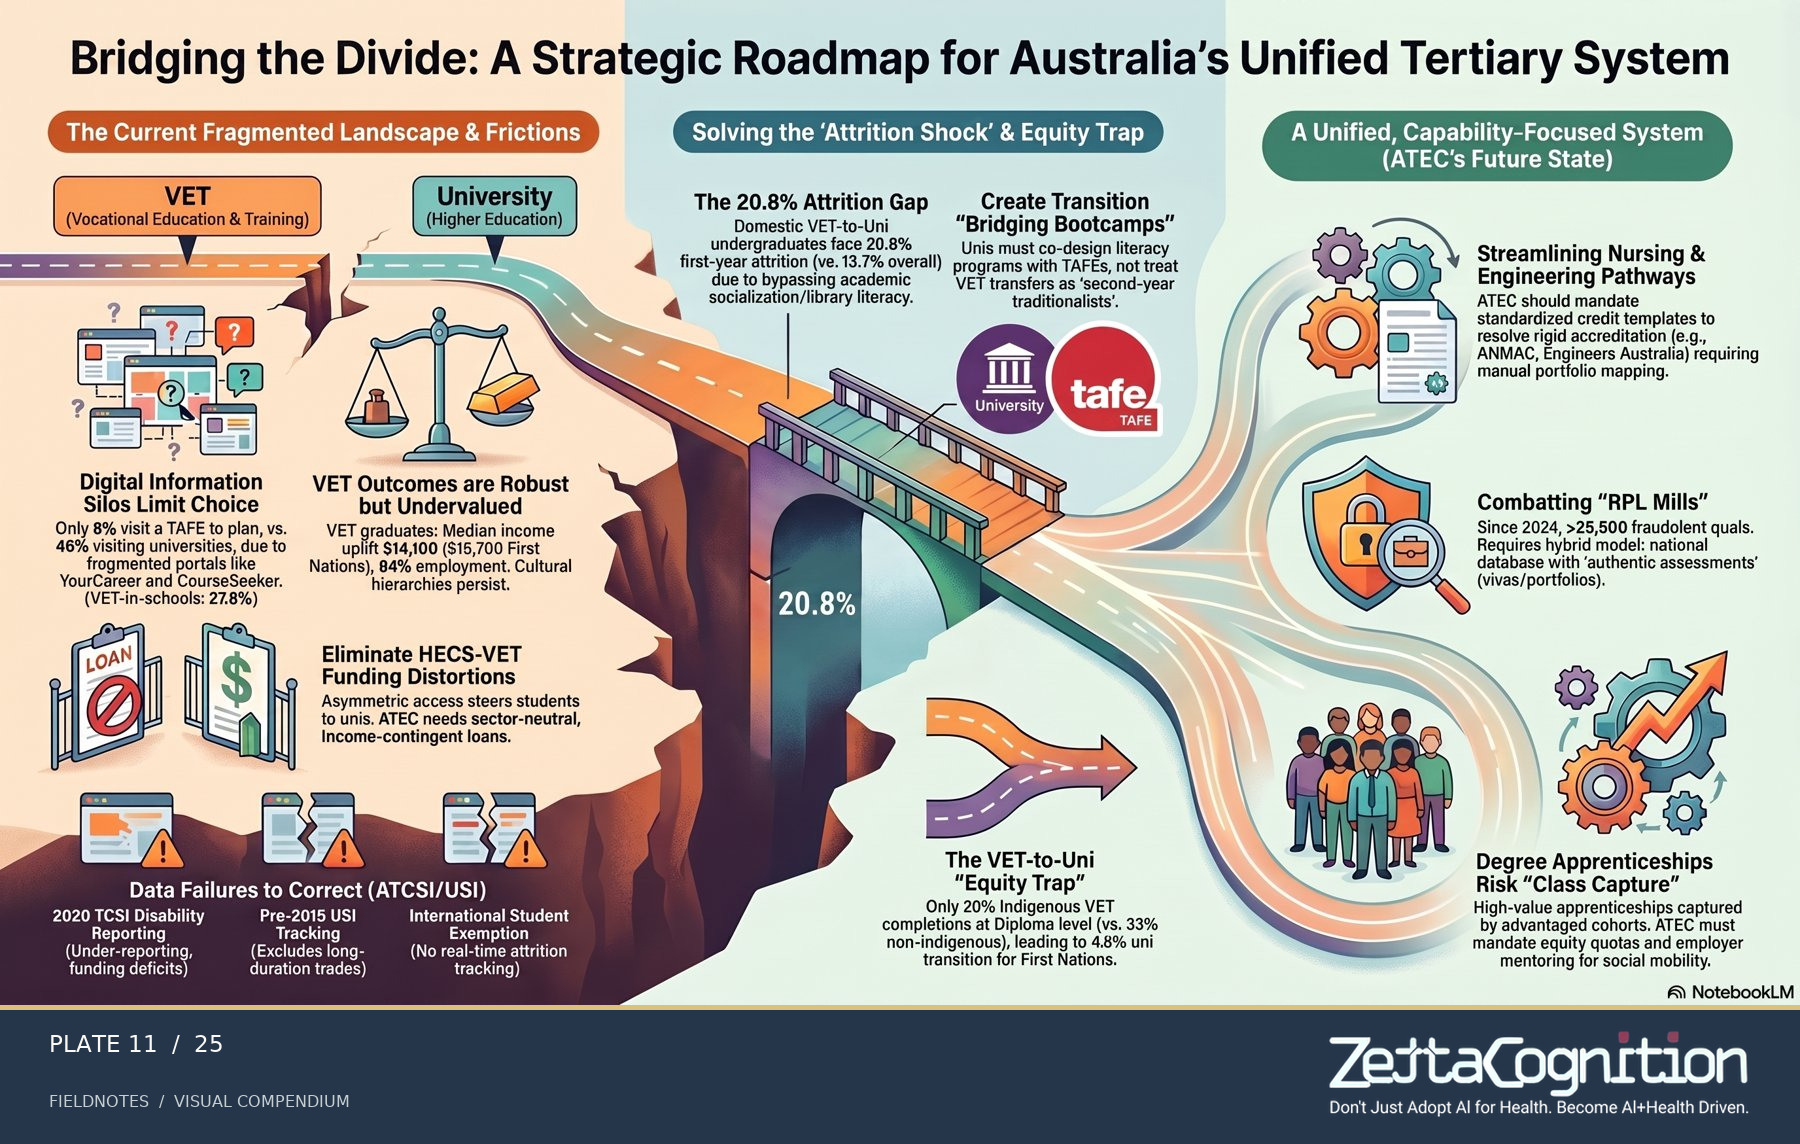
A unified tertiary roadmap
An illustrative route between qualifications, institutions and work.
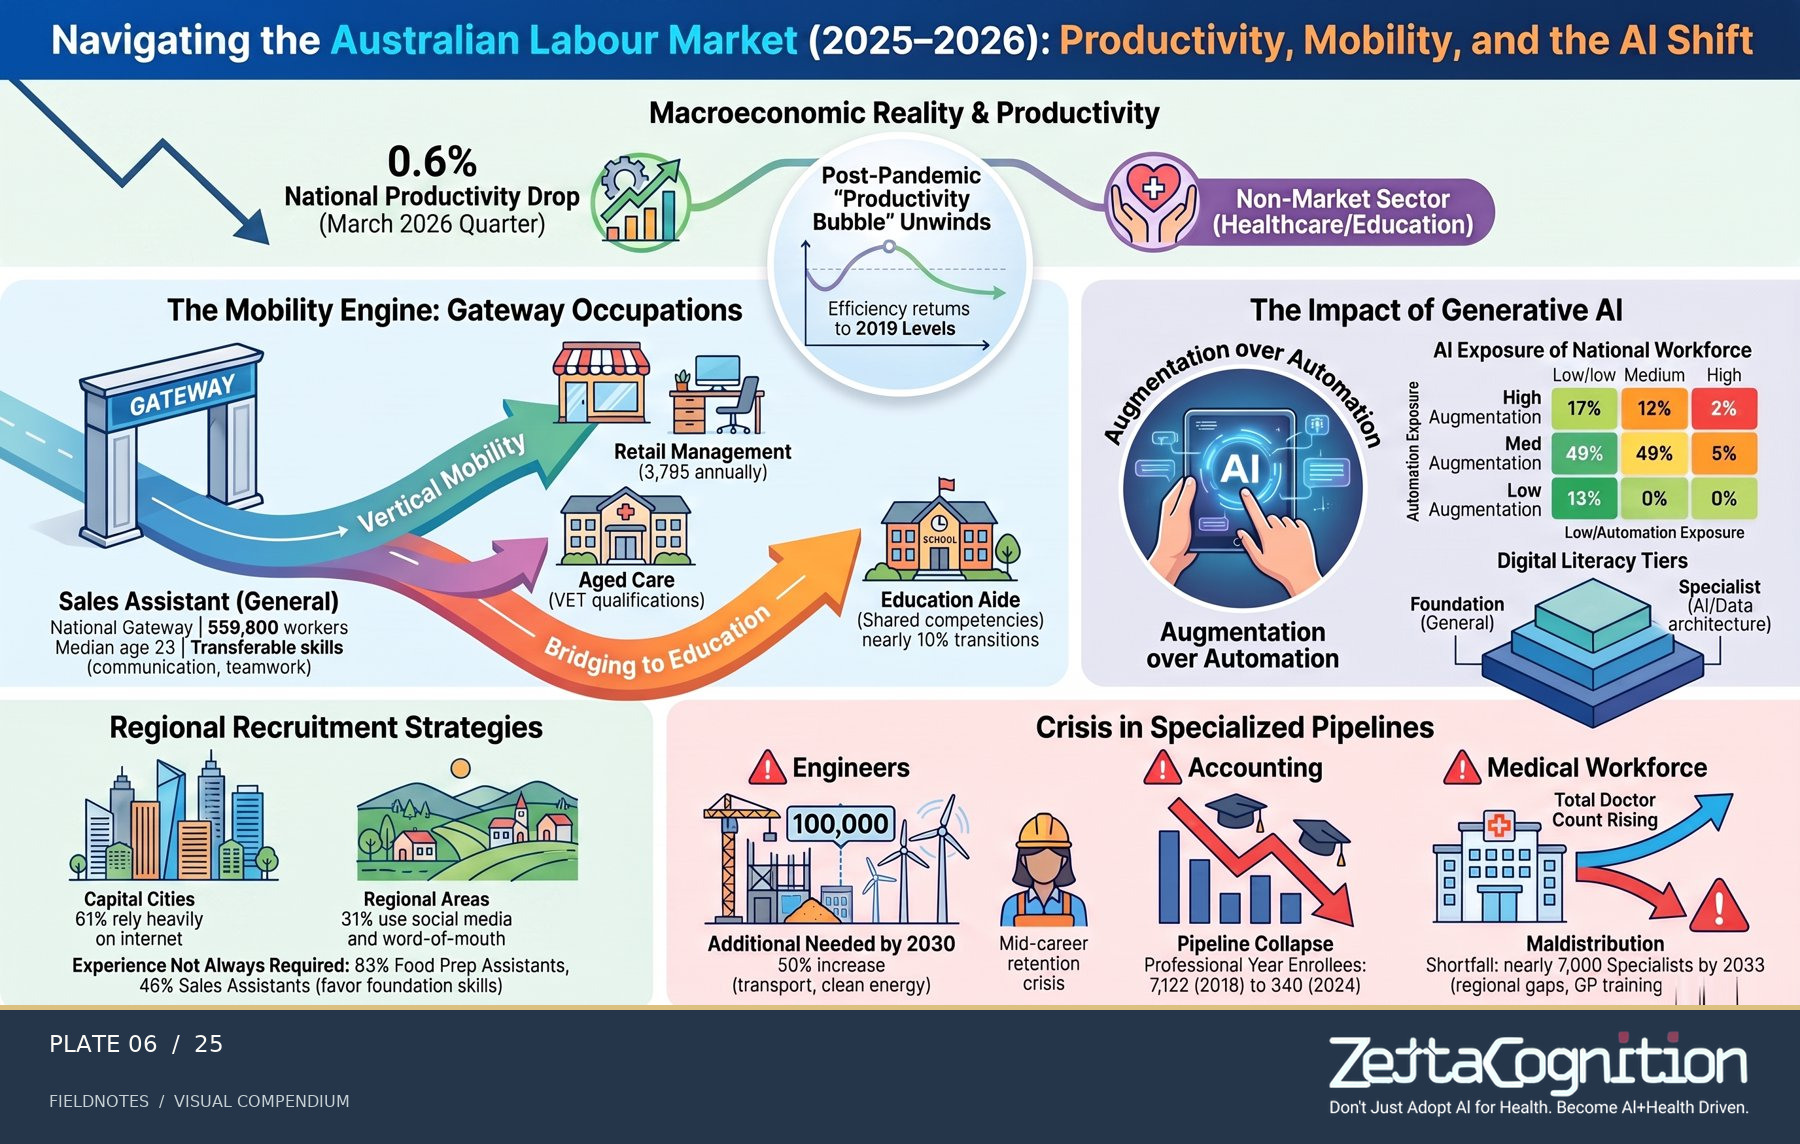
Navigating the labour market
Skills, productivity and mobility viewed as connected questions.
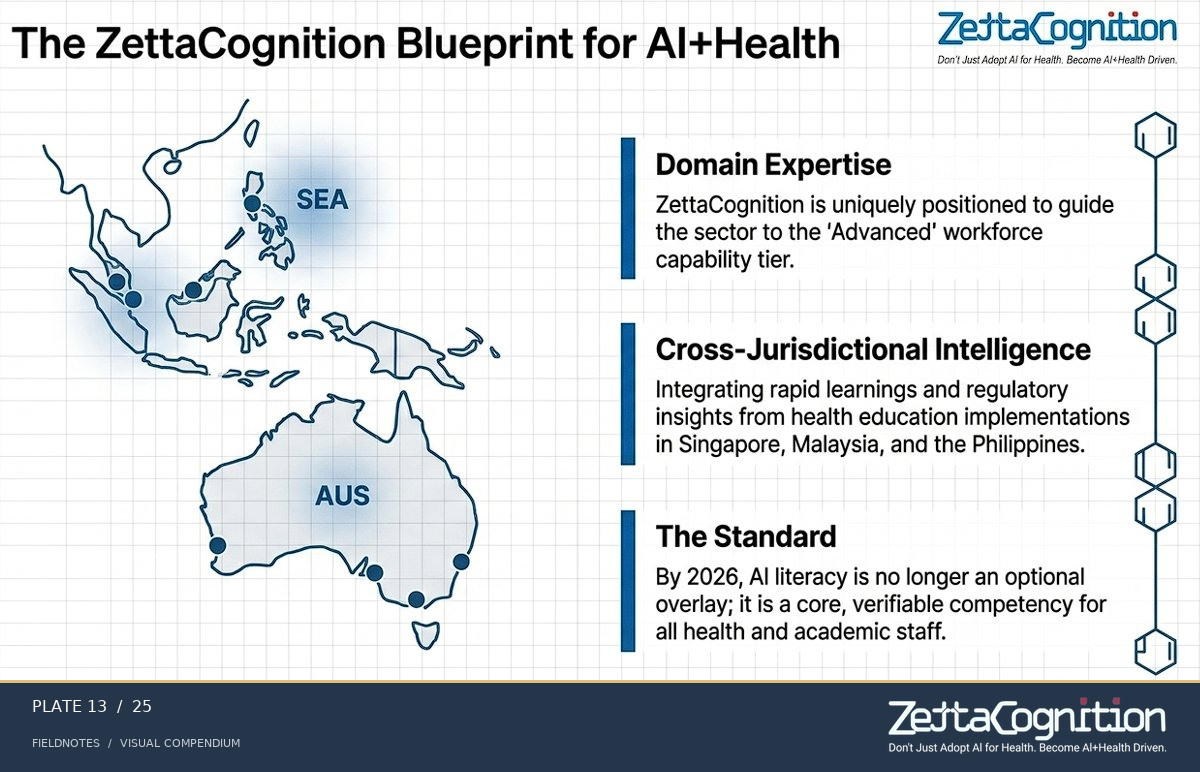
AI for health, with people at the centre
A healthcare-facing blueprint that returns the story to care, access and human judgement.
The story loops back to its beginning: infrastructure and governance matter only insofar as they support human capability and care.